← Back to feed
20 sourcesTracking since 11 Sept, 16:25

Bitcoin Suisse to cut up to 50% of Swiss staff in major restructuring push

How outlets framed it

0% favorable (0)88% neutral (7)13% critical (1)

critical: CryptoSlate.

Show how each outlet framed it
0% favorable (0)75% neutral (3)25% critical (1)

critical: CryptoSlate.

Show how each outlet framed it
Senate4 sources
0% favorable (0)75% neutral (3)25% critical (1)

critical: CryptoBriefing.

Show how each outlet framed it
House4 sources
0% favorable (0)100% neutral (4)0% critical (0)

All 4 sources reported it neutrally.

Show how each outlet framed it

One source, one vote (its latest article in the story). Only labels with confidence ≥ 0.6 are shown; the quote is the evidence.

Chronological coverage

  1. 18 September

  2. 17 September

  3. Follow-up17 Sept, 08:55

    BITCOIN stable after the Fed Rate Hike. What's next?

    Bitcoin (BTCUSD) has remained mostly stable following the Fed's 0.25 bps rate hike yesterday, despite an initial sell-off on the stock markets. This shows incredible resilience and as we approach the designated end of the Bear Cycle (October 2026) based on the 4-year Cycle Model, the market has now sustained the pressure of two major economic events (counting also Tuesday's Clarity Act failure). So the picture becomes clearer. According to the past three Bear Cycles since 2014, BTC is on almost an identical 1W RSI pattern of Higher Lows. Only a touch on that trend-line can deliver a price near $60k again, similar to what happened in August 2015 or a 0.5 Fib pull-back as in March 2023. As mentioned numerous times, a weekly closing above the 1W MA50 (blue trend-line), confirms the new Bull Cycle immediately. The 1W MA200 (orange trend-line) is the technical market Support at the moment and any potential test is a buy opportunity. Especially as Bitcoin enters the 6 week period before the U.S. mid-term elections, which is expected to inflict strong volatility into the markets. Another striking similarity on this chart is that, after every bottom, the early stages of the Bull Cycles that followed have been inside a Channel Up. In 2020/21 and 2017, those led to parabolic rallies when they broke. In 2024/25 it was much calmer and controlled, almost an extension of the Channel Up itself. So use that to your advantage and once the 1W MA50 breaks, every minor correction towards it, would be a Bull Cycle buy opportunity. So is there enough time for one last pull-back or the 1W MA50 will break first? Feel free to let us know in the comments section below! --- ** Please LIKE 👍, FOLLOW ✅, SHARE 🙌 and COMMENT ✍ if you enjoy this idea! Also share your ideas and charts in the comments section below! This is best way to keep it relevant, support us, keep the content here free and allow the idea to reach as many people as possible. ** --- 💸💸💸💸💸💸 👇 👇 👇 👇 👇 👇

    TITradingView Ideas
  4. Follow-up17 Sept, 08:27

    Bitcoin Daily Technical Analysis: Trading Channel at Midpoint

    Bitcoin price action continues to trade within a broad descending trading channel, with price currently consolidating around the midpoint of the range. The structure has the potential to develop into a bull flag, but confirmation would require price to maintain the current structure and eventually break above the relevant channel resistance. If the bull-flag structure holds and bullish momentum strengthens, a sustained move toward the $94,000 resistance area becomes a possible scenario. This level could act as an important test of whether buyers have enough strength to push price beyond the current consolidation. On the other hand, failure to maintain the bull-flag structure could result in further rotation within the broader channel. A loss of the current support region would increase the possibility of a deeper move toward the $67,500 area, which represents a lower region of interest within the larger range. For now, Bitcoin remains at a decision point between continuation and further range-bound consolidation. Monitoring how price reacts around the channel boundaries, alongside volume and market structure, may provide greater clarity on the next directional move. Neither scenario is confirmed until price establishes acceptance beyond the relevant levels. ---------------------------------------------------------------------------------------------- UK residents: Don't invest unless you're prepared to lose all the money you invest. This is a high-risk investment and you should not expect to be protected if something goes wrong. Take 2 mins to learn more: coinjar.com/uk/risk-summary The article is an opinion expressed by the author at a point in time and does not represent the views of CoinJar UK Limited or CoinJar Australia Pty Ltd. Take care to consider the date of this article and be aware that this opinion is based on circumstances at the time of publishing. No responsibility or liability is accepted for any errors of fact or omission expressed therein. Past performance is not a reliable indicator of future results. This above article is not to be read as investment, legal or tax advice and it takes no account of particular personal or market circumstances; all readers should seek independent investment advice before investing in cryptocurrencies. We recommend you obtain financial advice before making a decision to use your credit card to purchase cryptoassets or to invest in cryptoassets.In the UK, it's legal to buy, hold, and trade crypto, however cryptocurrency is not regulated in the UK. It's vital to understand that once your money is in the crypto ecosystem, there are no rules to protect it, unlike with regular investments. You should not expect to be protected if something goes wrong. So, if you make any crypto-related investments, you're unlikely to have recourse to the Financial Services Compensation Scheme (FSCS) or the Financial Ombudsman Service (FOS) if something goes wrong. ---------------------------------------------------------------------------------------------- EU residents: Warning: If you invest in this product, you may lose some, or all, of the money you invest. The value of crypto-assets may rise or fall rapidly. Past performance is not indicative of future results. To learn more see our Risk Disclosures. CoinJar Europe Limited is authorised by the Central Bank of Ireland as a crypto-asset service provider (registration number C496731) ----------------------------------------------------------------------------------------------

    TITradingView Ideas
  5. Follow-up17 Sept, 04:48

    Bitcoin Pullback Ahead? Why I’m Watching the $67K Buy Zone

    To identify potential Bitcoin price scenarios, I conduct a comprehensive analysis across multiple timeframes, moving from the higher timeframes to the lower ones. This approach allows me to establish the broader market context first and then identify more precise areas for potential entries. https://www.tradingview.com/chart/c7VBCJky/ Monthly timeframe I always begin my analysis with the monthly chart. At this stage, the key area is the $82,000–83,000 zone. It is important to treat it as a range rather than one exact price level. Historically, this area has influenced the market on several occasions. In 2025, it acted as support, from which Bitcoin subsequently rallied towards its previous all-time high. The market is now retesting the same area from below, which means it is currently functioning as resistance. Therefore, the long-term timeframe is not yet providing a sufficiently strong or convincing buy signal. In my analysis, I use different colours for levels and chart objects originating from different timeframes. Monthly levels are always marked in red, weekly levels in pink, and lower-timeframe structures in other colours. This allows me to move to a lower timeframe and immediately understand where a particular level originated and how much weight its signal should carry. The underlying principle is straightforward: the higher the timeframe, the stronger the signal. For example, if a four-hour support zone produces a potential buy signal while the price is simultaneously approaching monthly resistance and generating a sell signal, I will generally prioritise the higher-timeframe signal. https://www.tradingview.com/chart/c7VBCJky/ Weekly timeframe The weekly chart continues to show a long-term uptrend, marked in pink. The third point of contact with the lower trend boundary performed exceptionally well in July. The strong upward impulse we observed originated directly from this trend support. This is another example of technical analysis working effectively when it is applied comprehensively and supported by disciplined risk management. The price is currently positioned between several important technical areas. The moving averages around $74,000–76,000 are still providing a degree of support. However, this support appears weaker than the monthly resistance located around $82,000–83,000. Consequently, buying Bitcoin at the current levels has some technical justification, but there is also a meaningful risk of a deeper decline. If I begin building a position at the current price, I need to allocate my capital accordingly and retain sufficient capacity to increase the position at lower levels. https://www.tradingview.com/chart/c7VBCJky/ Daily timeframe The daily chart clearly shows the monthly resistance around $82,000–83,000. Because this level originates from the higher timeframe, it carries greater significance. At the same time, a local uptrend has formed on the daily chart. Its first point was established in July, the second around the middle of August, and a potential third point may form within the $67,000–68,000 area. This zone also coincides with horizontal support around $67,000, providing additional technical confluence. For that reason, the $67,000–68,000 area represents a potentially attractive buying opportunity. A buy-limit order could already be considered within this zone. The stop-loss should be placed below $67,000, with sufficient room for normal price volatility — potentially around $64,000–65,000. Under this scenario, the initial target and minimum upside objective would be a return towards $82,000. 4-hour timeframe I use the four-hour chart to assess the current market structure and identify potential swing-trading opportunities within the week. Following the previous sharp upward impulse, the area around $76,000 repeatedly acted as support. The impulse itself had the characteristics of a short squeeze. As sellers’ stop-loss orders were triggered, the resulting forced buying added further momentum and accelerated the move higher. Compared with traditional financial markets, Bitcoin remains a relatively low-liquidity instrument. At certain moments, insufficient market liquidity can therefore produce especially sharp and volatile price movements. In general, the relationship is inverse: the greater the liquidity, the lower the volatility — and vice versa. Applying a Fibonacci retracement to the initial upward impulse shows that the subsequent pullback almost perfectly reached the 78.6% retracement level, located around $76,000. This support zone then produced three noticeable rebounds. However, the price is now beginning to break through it. To me, this suggests that support around $76,000 is becoming exhausted. The latest local high was also lower than the previous one. Bitcoin initially reached approximately $82,000, while the following rally extended only towards $80,000. The subsequent highs and lows are also beginning to move lower. This structure reduces the probability of an immediate continuation of the previous strong upward move. The fundamental backdrop is not currently providing a sufficient catalyst for further growth either. The CLARITY Act did not pass in the United States, meaning that the market did not receive the positive development it had been anticipating. This provides additional confirmation for my scenario in which Bitcoin retains the potential to move lower. Overall scenario Opening a short position from the current levels is theoretically possible. However, such a trade would be taken against the broader long-term trend and would therefore carry elevated risk. I prefer to look for opportunities in the direction of the prevailing trend. For this reason, my preferred scenario remains a potential Bitcoin purchase within the $67,000–68,000 zone, with a stop-loss below the level — potentially around $64,000–65,000. The first upside target would be the $82,000 area. Any position should nevertheless be structured with appropriate risk management and sufficient capital reserved for gradual accumulation at lower prices.

    TITradingView Ideas
  6. 16 September

  7. Follow-up16 Sept, 21:53

    Bitcoin Macro Update: Dual-Scenario Framework & The 2023 Fractal

    I jumped the gun... Images Below... Sell-side pressure from both monetary policy (a hawkish 25 bps Federal Reserve rate hike) and regulatory friction (Senate gridlock on the CLARITY Act alongside ongoing SEC enforcement overhang) has accelerated market volatility. High-timeframe market structure points to a structural higher-low retest, where both primary trading scenarios converge on the same execution floor. --- ### 📊 Dual-Scenario Cycle Framework **Scenario A: Macro 2023 Fractal Roadmap (4-Stage Sweep Sequence)** * 📉 **Stage 1 — The Bull Trap & Dynamic WMA Flush ` `:** Price drops lower to flush overleveraged longs, currently hovering directly over dynamic **SHM 63 WMA support ($75,000–$76,000)**. This localized drop acts as a bull trap, convincing weak hands that market structure has broken down before the next rotational move. * 🐻 **Stage 2 — The Bear Trap & Range-High Sweep:** A sudden upward pivot tricks overconfident bears who opened short positions at the WMA. Bulls regain full market control, triggering a rapid short squeeze that sweeps liquidity above the previous **$82,800–$84,000 range highs**. * 🎯 **Stage 3 — Post-Sweep Golden Zone Reset:** Having captured liquidity at the highs, price pulls back once more to perform a deep structural test of the **0.50–0.74 Golden Zone ($71,000–$72,000)**, holding dynamic **CIMA MA support** to establish a rock-solid macro higher-low. * 🚀 **Stage 4 — Parabolic Macro Breakout:** Defense of the dynamic CIMA floor resolves all range consolidation, launching price into blue-sky price discovery toward **$100,000+**. **Scenario B: Direct 4-Stage Liquidation Flush** * ⚡ **Stage 1 — Immediate Golden Zone Flush ` `:** Bypasses the Stage 2 overhead sweep entirely, executing an uninterrupted liquidation drop from current levels directly into the **$71,000–$72,000 Golden Zone** (0.50–0.74 retracement + CIMA support). * 🏛️ **Stage 2 — Institutional Base:** Absorption of sell-side pressure driven by SEC Chairman Paul Atkins' proposed **Regulation Crypto Assets** framework, establishing a tight accumulation floor. * 📈 **Stage 3 — Bear Liquidation & SHM Reclaim:** Reclaim of the SHM 63 WMA traps overextended shorts and converts dynamic resistance back into support. * 🎯 **Stage 4 — Parabolic Price Discovery:** Expansion beyond the $82,800–$84,000 ceiling directly toward **$100,000+**. --- ### 🏛️ Macro Drivers: Dual Sell-Side Pressure vs. Executive Offset * 🦅 **Federal Reserve Monetary Tightening:** Today's 25 bps rate hike and upward dot-plot revision to 4.1% apply systematic discount-rate pressure across all high-beta risk assets, compressing liquidity. * 📜 **SEC & Legislative Friction:** Congress failing to pass the CLARITY Act alongside persistent SEC regulatory enforcement actions reinforces short-term sell-side headwinds. * ⚖️ **Executive Agency Offset:** SEC Chairman Paul Atkins' proposed **Regulation Crypto Assets** framework—offering fit-for-purpose token exemptions and an investment contract safe harbor—provides agency-level regulatory clarity. Institutional capital is positioned to leverage this executive framework to absorb sell-side volume inside our demand floor. --- ### 🛠️ Execution Strategy & Buy Confirmation Rules Price may temporarily drop through the **SHM 63 WMA** during a high-volatility flush. **Do not front-run the dip.** Long entry exposure requires price to push back up through the 63 WMA using one of three systematic triggers: 1. 🟢 **Reclaim + SHM BUY Signal:** Price reclaims the SHM 63 WMA and triggers an official indicator BUY signal. 2. 🕯️ **Full Candle Close Above 63 WMA:** A 4H or Daily candle closes firmly above the SHM 63 WMA. 3. 🔄 **Break & Retest Hold:** A clean breakout above the SHM 63 WMA followed by a successful retest that holds as new dynamic support. --- ### 🗺️ Strategic Liquidity Roadmap * 🛡️ **$75,000 – $76,000 (Dynamic WMA Defense):** **Scenario A: Stage 1 ` **`. Initial Bull Trap zone. Monitor for order flow absorption and price hovering over the SHM 63 WMA to confirm local seller exhaustion. * 🎯 **$82,800 – $84,000 (Bear Liquidation Sweep):** **Scenario A: Stage 2 Target**. Primary short-trap ceiling; key target for taking partial profits on Stage 2 impulse legs before any secondary Stage 3 reset. * 📥 **$71,000 – $72,000 (0.50–0.74 Macro Floor):** **Scenario B: Stage 1 ` ` / Scenario A: Stage 3 Target**. High-conviction re-accumulation anchor where dynamic CIMA support and deep Fib retracement levels align for institutional absorption. * 🚀 **$100,000+ (Blue-Sky Price Discovery):** **Scenario A & B: Stage 4 Target**. Parabolic macro expansion target upon defense of the dynamic CIMA floor and clean breakout above range-high resistance. --- ### 🚨 Macro Invalidation & Full Bull Failure If price fails to hold **$71,000** on a daily closing basis, loses dynamic CIMA moving average support, and triggers an official indicator **SELL signal**, the entire bull thesis is fully invalidated. This combination signals a transition from a corrective re-accumulation dip into a high-timeframe bear market distribution. https://www.tradingview.com/x/6PPHJaUP/ https://www.tradingview.com/x/ZdSKzcfw/ ⚠️ **Disclaimer:** *This update is for educational and technical analysis purposes only and does not constitute financial, investment, or trading advice. Any and all financial assets are subject to market volatility and carry substantial financial risk. Always perform your own research, manage risk appropriately, and consult a certified financial advisor before making any investment decisions.*

    TITradingView Ideas
  8. Follow-up16 Sept, 21:31

    Bitcoin Falls $76,000 After Senate Rejects CLARITY Act Motion

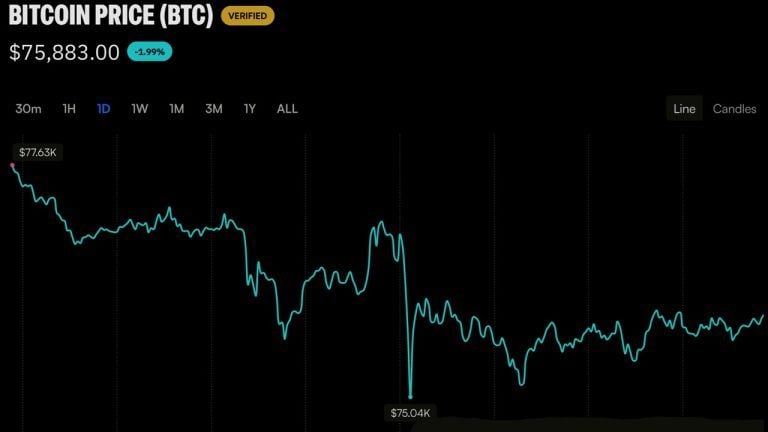
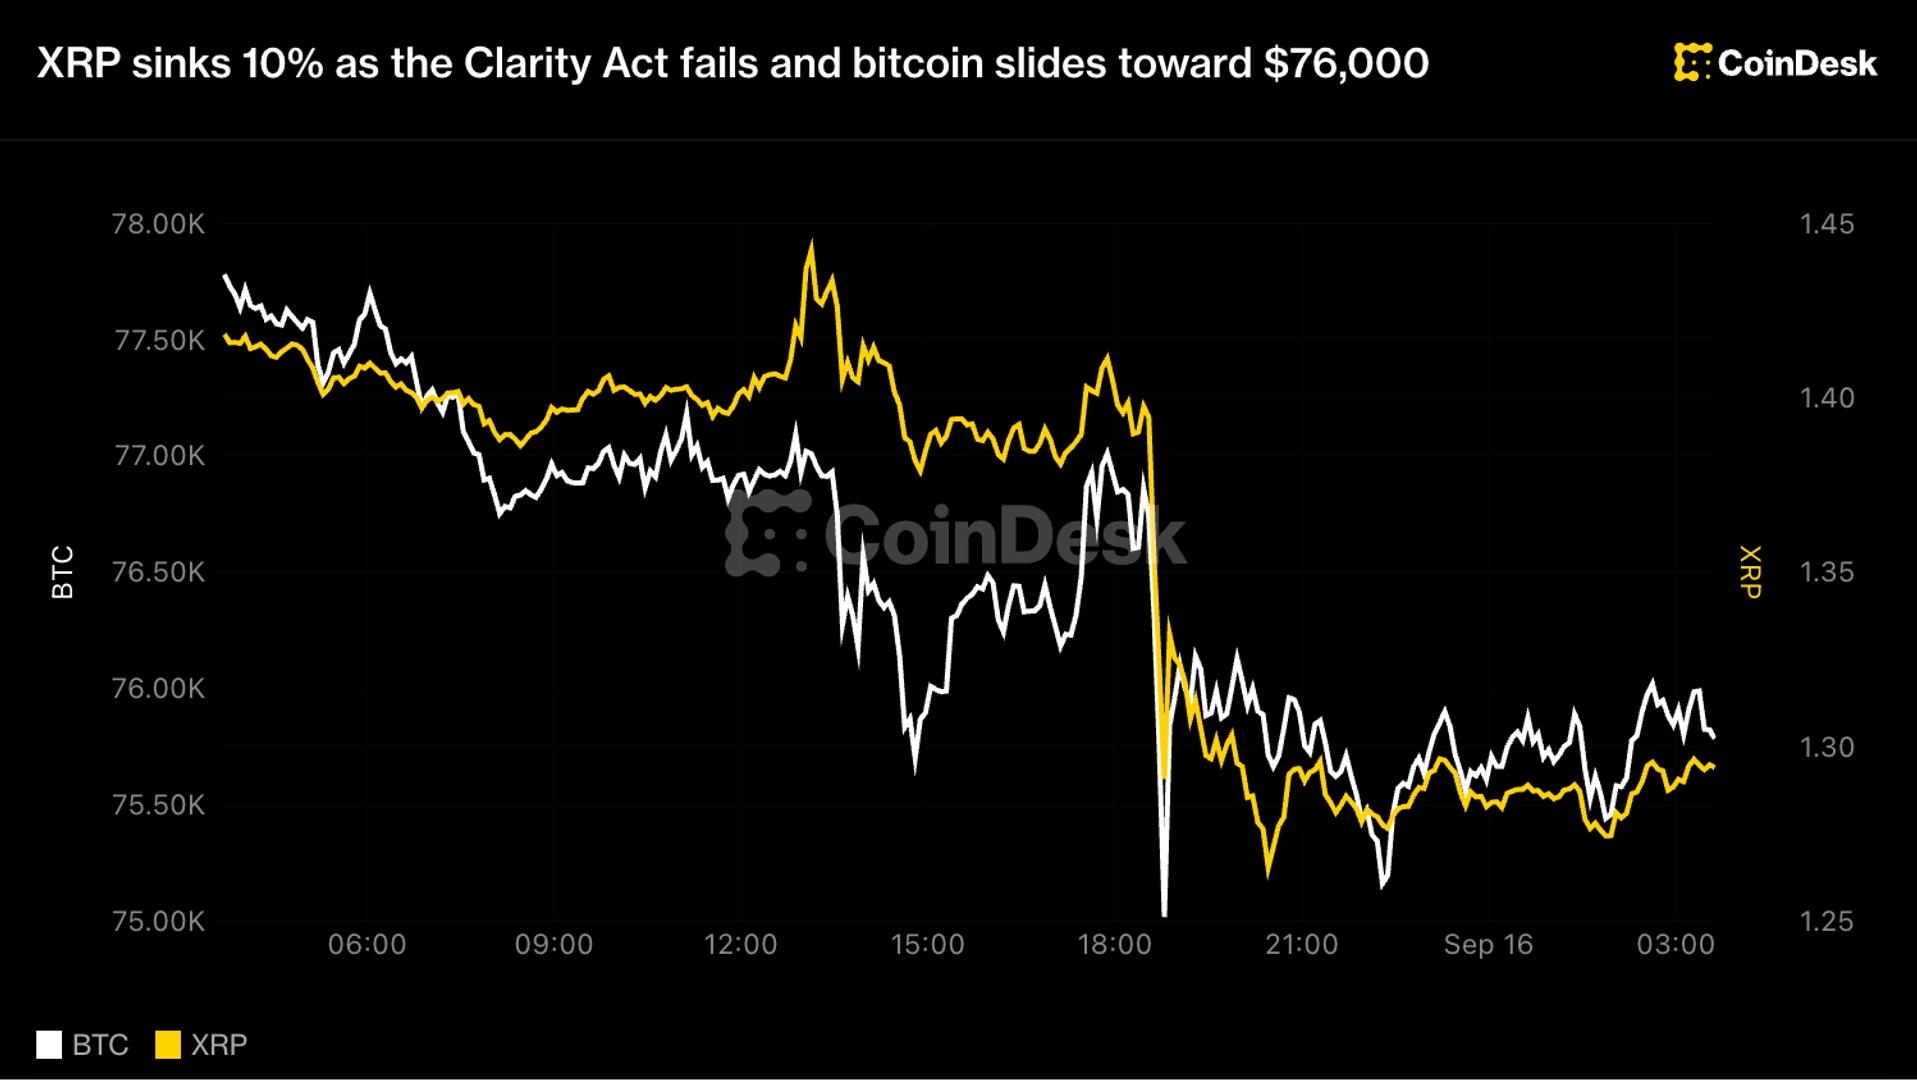
    Bitcoin dropped below $76,000 on Sept. 15 after the Senate rejected a motion related to the CLARITY Act, but the timeline of the decline shows that the cryptocurrency was already under pressure before the vote took place. Bitcoin hit an intraday low of $74,967.97 during the session. It had already fallen below $76,000 before the Senate tally, meaning the political disappointment in Washington did not start the sell-off. Instead, it arrived while the market was already moving lower. The broader altcoin market also weakened during the same period. The altcoin market capitalization tumbled 3.6%, though it managed to remain above $1.15 trillion. That decline shows that the pressure was not isolated to Bitcoin. It spread across the wider digital asset market, affecting risk sentiment more broadly. Even so, the fact that the altcoin market cap held above $1.15 trillion suggests that the sell-off, while notable, did not immediately turn into a deeper capitulation event. Traders were also preparing for a Federal Reserve decision, which added another source of pressure across risk assets. When investors are waiting on a major central bank announcement, they often reduce exposure to speculative assets, and crypto is frequently among the first areas to feel that de-risking. That pre-Fed caution likely contributed to the softer tone in Bitcoin and altcoins before the Senate vote even became the focus. In other words, the market was already dealing with macro uncertainty, and the political news landed on top of an existing pullback. The chronology matters because it changes how the Senate vote should be interpreted. It supports describing the rejection of the CLARITY Act motion as one factor in the afternoon weakness, but not as the origin of the full-day decline. The vote may have worsened sentiment or accelerated selling during a specific window, but it was not the sole cause of Bitcoin’s move below $76,000. The market was already vulnerable, already cautious, and already leaning defensive ahead of the Fed. Bitcoin Absorbs Initial Pre-Fed Sell-Off, Leaving $70,000 as a Critical Test Bitcoin has so far absorbed the initial pre-Fed sell-off, but that resilience does not mean the risk has passed. The next major test is whether a hawkish Fed can push BTC through the $70,000 support zone and materially damage the August recovery. That level has become a key technical and psychological marker. If Bitcoin holds above it, the market may treat the recent decline as a normal pullback within a broader recovery. If it breaks below it, the damage could be more significant, potentially undermining the gains that were built during August. The $70,000 zone is important because it represents a line between a healthy correction and a deeper trend reversal. A hawkish Fed decision could strengthen the dollar, push yields higher, and reduce appetite for risk assets, all of which would pressure Bitcoin. In that scenario, sellers might test the $70,000 support with greater force. If that support fails, the market could begin to question whether the August recovery was sustainable or whether it was simply a temporary bounce within a larger downtrend. On the other hand, if Bitcoin continues to absorb pre-Fed selling and holds above $70,000, it would suggest that buyers are still willing to step in at lower levels. That would not eliminate the risk of further volatility, but it would signal that the market still has a foundation to build on. The August recovery would remain intact, and the recent drop below $76,000 would look more like a shakeout than the start of a sustained decline. For now, the situation is best described as a market under pressure but not yet broken. Bitcoin’s decline began before the Senate rejected the CLARITY Act motion, and the Fed decision remains a larger macro driver. The vote added to the afternoon weakness, but it did not create the full-day sell-off. The critical question ahead is whether Bitcoin can defend $70,000 if the Fed takes a hawkish stance. If it can, the recovery may survive. If it cannot, the market could face a much more serious test of its recent gains.

    TITradingView Ideas
  9. Follow-up16 Sept, 21:15

    Bitcoin 4-Year Supercycle Begins | Positive Rate Hike Signal!!

    First, I want to explain the 4-year cycles. You may have heard many explanations like this across the internet, but this one is different... Years of my research have shown me that after each halving, the best time to sell is around Day 543, while Day 373 marks the time to start buying and accumulating. This system has worked better for long-term holders than any other system I have studied. But what makes this analysis different? In previous cycles, there were three important criteria: Bitcoin had to move above the Short-Term Holder Realized Price, move above the 50-week moving average, and our Supertrend had to generate a bullish signal. However, we are gradually seeing changes in both of the last two cycles. In the 2023 cycle, even though the Supercycle had already started, the Federal Reserve raised interest rates four more times. Interestingly, at the beginning of the 2026 cycle, two changes have appeared that are very similar to the previous cycle. The U.S. Federal Reserve has started raising interest rates again, which is extremely interesting. The second change is that the Supercycle has started earlier than Day 373. Now we have to ask: Why? The reason is very clear. On-chain, there is an indicator called Accumulation Trend Score / Accumulation Holders. These are holders who mostly buy, sell very late, or never sell at all. Throughout this cycle, as time progressed, this group continued accumulating more and more Bitcoin and even reached new highs in terms of their holdings. The second factor is ETFs and companies. They have still not significantly retreated from Bitcoin. They have remained in the market and continued to hold. The third factor is very interesting. Almost the entire social media space believed that the market had to experience one final wave of downside during the bear market. And while that idea is completely understandable, there is one major flaw in it. In previous cycles, retail investors and even so-called tourist investors often ignored this possibility. But with the growth of social media and the increasing awareness of Bitcoin cycles, large market participants were able to catch these participants off guard. They did not want to allow weak hands to enter the market alongside them. The plan changed, creating a major shakeout for these participants. If I were in their position, I would probably follow the same approach. I would not want to carry weak hands with me into the next major phase of the market. I am absolutely not telling you to buy Bitcoin based on this analysis. However, I believe that sooner or later, this price correction and the supply-side inflationary pressure created by the Iran–U.S. conflict around the Strait of Hormuz will come to an end. When oil eventually falls from its highest levels, the Federal Reserve may be forced to cut interest rates aggressively, and it may even have to resort to Quantitative Easing. Otherwise, the economy could face a recession. At the moment, most of the demand for Bitcoin is coming from outside the United States. But the day we see significant demand coming through the Coinbase Premium and the indicator turns positive, the price action could become very interesting. This analysis is not financial advice. Thank you, Mr. Ghasemi

    TITradingView Ideas
  10. Follow-up16 Sept, 20:06

    Bitcoin Holds $75K After the Fed — Is $80K Next?

    Bitcoin ( BINANCE:BTCUSDT ) experienced sharp volatility after the Federal Funds Rate was released at 4.00%, in line with expectations, followed by remarks from Kevin Warsh. Unlike gold and U.S. stock indices—particularly the S&P 500—Bitcoin has so far managed to hold inside its Support Zone and avoid a similarly sharp decline. Can BTC defend $75,000 and turn this relative strength into another move toward $80,000? Macro Outlook Nearly $1 billion in long positions could be liquidated around $74,860, making this an important downside liquidity area to monitor. Bitcoin could also remain sensitive to developments in the Middle East, movements in the S&P 500, and gold price action. Technical Analysis Bitcoin is currently trading inside the Support Zone and near Cumulative Long Liquidation Leverage($74,680-$73,800). A valid Golden Cross has also formed between the 50_SMA(Daily) and 200_SMA(Daily), which could support the broader bullish structure. 💡 Educational Note: A Golden Cross forms when a shorter-term moving average crosses above a longer-term moving average and is generally considered a bullish trend signal, although price confirmation remains important. From an Elliott Wave perspective, Bitcoin’s structure over the past 12 days appears more corrective than impulsively bearish, suggesting that another bullish move could develop. I expect Bitcoin to move higher over the coming hours. If BTC breaks above the key trading level of $77,280, further upside could develop toward $78,370 and eventually the Cumulative Short Liquidation Leverage. As long as Bitcoin remains above $73,500, the bullish scenario remains valid. Trade Setup First Take Profit(TP): $76,990 Second Take Profit(TP): $78,370 Third Take Profit(TP): Cumulative Short Liquidation Leverage($80,700-$79,800) Stop Loss(SL): $73,500(Worst) Key Trading Level: $77,280 New CME Gap: $79,270-$79,110 Do you think Bitcoin can hold above $75,000? 🟢 Yes 🔴 No 📌 Bitcoin Analysis(BTCUSDT), 1-hour time frame. 🛑 Always use proper risk management and set a Stop Loss(SL) for every position. 🚀 If this analysis helps your trading plan, a BOOST would help more traders discover it.

    TITradingView Ideas
  11. Follow-up16 Sept, 19:05

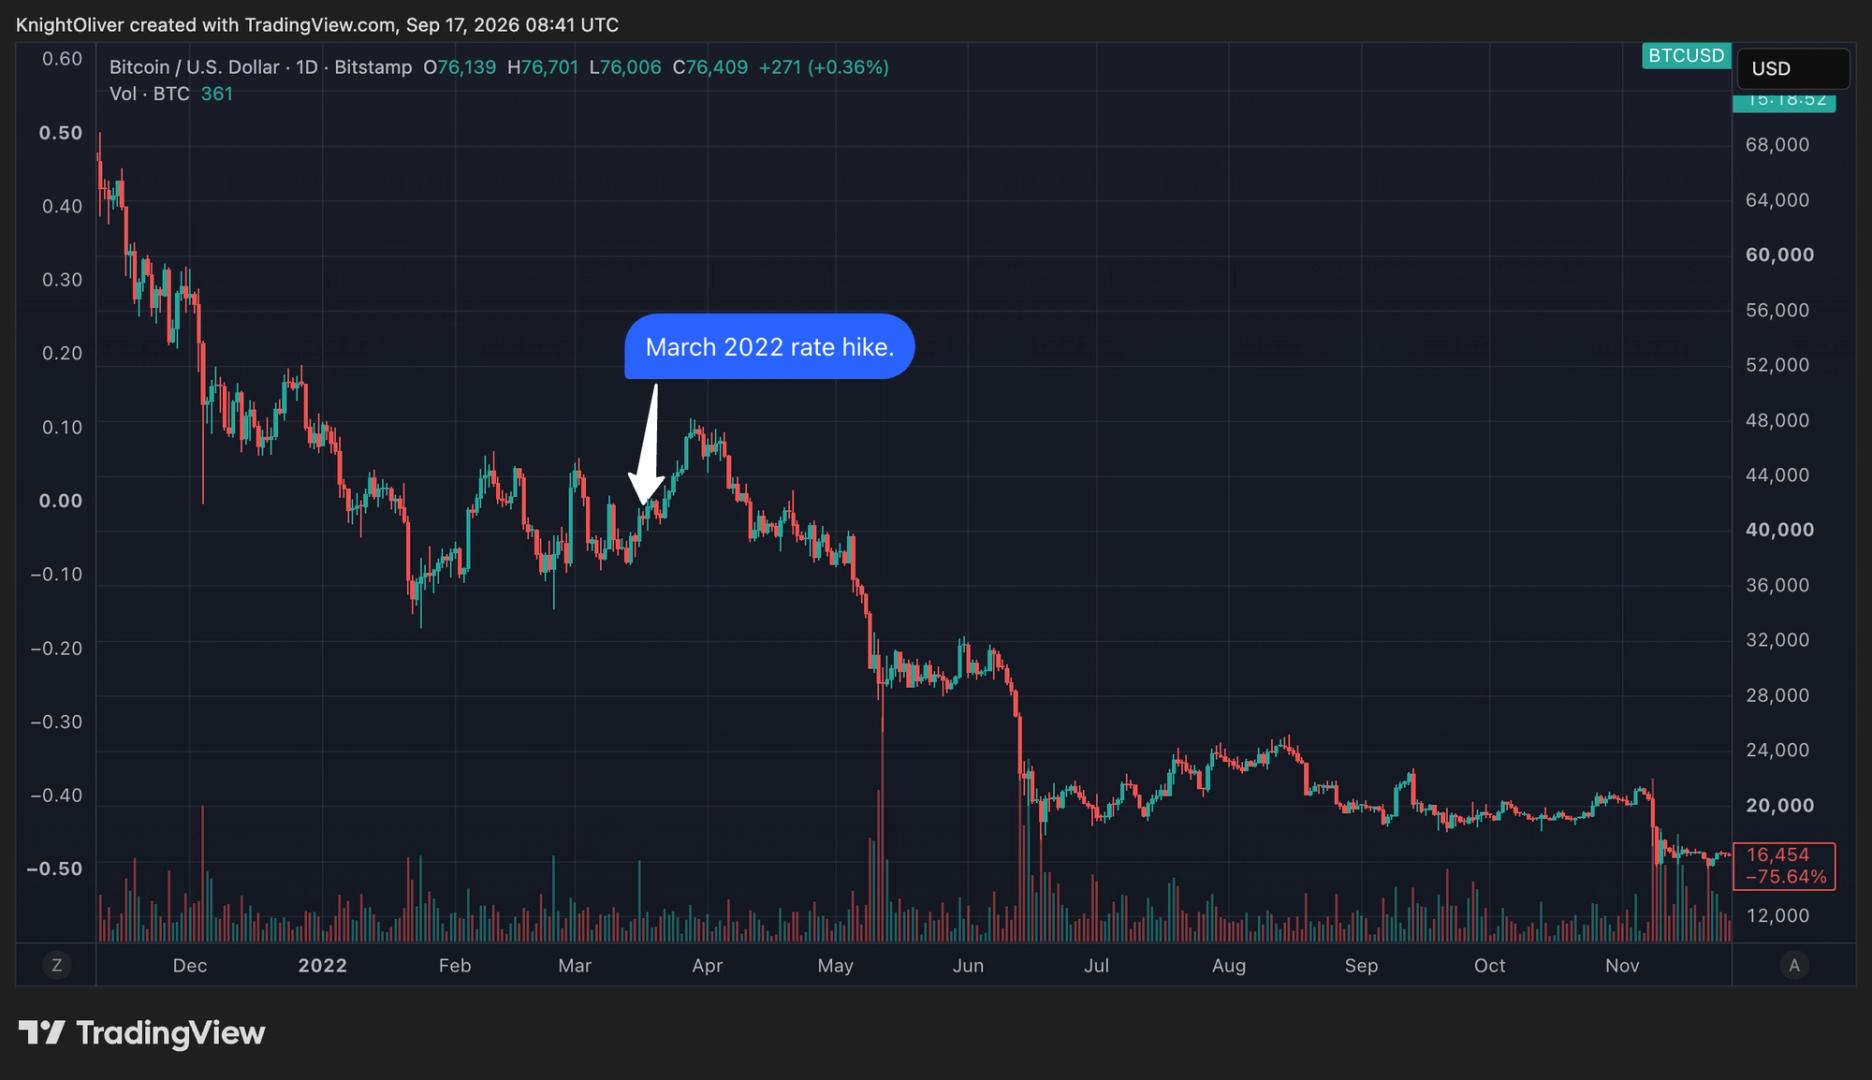
    Bitcoin PA and US Fed Rate Rises since 2021 - the Effects

    So, The USA Federal Reserve just raised rates by 25 points as expected. And the question on most peoples minds is "Will this upset my trading?" And if, Like Me, you focus on BITCOIN, you should pay attention but more to what it does to OTHER ASSETS. The Main chart shows Bitcoin INDEX and All the Rate decisions, when they happened. ( It is a weekly chart so the EXACT day is not there but it is in that week) The whole Chart is to Big to fit on one screen so here is the chart from the 2021 ATH to the Mid 2024 range. https://www.tradingview.com/x/Z31vydJH/ What are these RED and GREEN Boxes? In the Chart from 2021, the first RED Box is where the US FED raised Rates and Bitcoin PA Dropped. Many would say this would be expected as borrowing got more expensive. The Fed Effect However, the GREEN box that Follows is were the FED CONTINUED to Raise Rates but Bitcoin PA ROSE or Ranged. It DID NOT Drop like a Stone as previously. NO FED EFFECT The Main chart also has a RED box, https://www.tradingview.com/x/VicHO22z/ As you can see, this is were Bitcoin Dropped after that October 2025 ATH. But the FED Was Lowering the interest Rate for Borrowing ! Why was Bitcoin not paying attention ? Again, NO FED EFFECT There are many reasons, other assets were more favourable, Mostly due to Bitcoin being OVER BOUGHT on may time frames and Due a Bear Market after ATH. So, as you can See, BITCOIN Follows its own rules and one reason for that, and this needs to be remembered, BITCOIN IS NON CENTRALIZED> IT IS NOT BASED IN THE USA IT DOES NOT NEED TO BE EFFECTED BY THE FED and as you can very clearlly see here, It often Is not. That is NOT a insult to the USA, just a Fact. There are many HUGE American Bitcoin investors and YES, for them ,borrowing to buy Bitcoin costs more.... WE just have to wait and see where Bitcoin WANTS to go next.......but I do not think that recent BULLISH moves will be undone by raises in interest Rates in the USA BUT WE DO NEED TO REMAIN CAUTIOUS AS GLOBAL MACRO WILL HAVE EFFECTS. And yes I was shouting Sorry Stay Safe, Love one another and BUY BITCOIN

    TITradingView Ideas
  12. Follow-up16 Sept, 13:34

    BITCOIN / USD — 2H DETAILED TECHNICAL ANALYSIS

    ₿ BITCOIN / USD — 2H DETAILED TECHNICAL ANALYSIS 📊 🔻 Bearish Channel + Liquidity + FVG Structure Current price shown: ~75,722 Chart timeframe: 2H Structure: Bearish / corrective Major resistance: ~82,313 Major demand/FVG: ~73,000–74,100 1️⃣ MARKET STRUCTURE 🧭 The chart shows a clear sequence of lower highs and lower lows inside descending bearish channels. Price initially moved through a strong bullish expansion around the 21st, but after reaching the 82K resistance region, sellers became active. From the 82K area, BTC started forming: Lower High → Lower Low → Lower High → Lower Low This structure currently favors sellers unless price can reclaim the important overhead resistance zones. 2️⃣ BEARISH CHANNEL 📉 There are two visible descending channel structures. The most recent channel is particularly important because price repeatedly respected its upper and lower boundaries. The upper channel line acted as dynamic resistance, while the lower boundary provided temporary support. Eventually, BTC broke lower from this structure and accelerated toward the 75K area. ⚠️ This suggests that the previous channel support did not produce a strong enough reversal. 3️⃣ CURRENT PRICE ACTION 🔍 Price is currently hovering around 75.7K after a sharp decline from approximately 79K–80K. The candles around 75K show some consolidation. This is important because consolidation after a strong decline can produce two possibilities: 🔻 Continuation Price makes a small relief bounce, fails to reclaim resistance, and then resumes the downside. 🔄 Reversal Price establishes a higher low, breaks the nearby resistance, and begins recovering toward 78K–80K. At the moment, the chart itself does not yet show a confirmed bullish reversal. 4️⃣ IMPORTANT RESISTANCE ZONES 🧱 🔴 76,800–77,300 This is the first area I would monitor if BTC produces a relief bounce. A rejection here could create another lower high. 🔴 78,000–79,000 This is a more significant reaction zone because previous price action consolidated and reacted around this region. A strong reclaim would weaken the immediate bearish structure. 🔴 79,500–80,000 This is another major supply/rejection area. If price reaches this region, watch carefully for: bearish rejection candles failed breakout lower-timeframe market-structure shift decreasing momentum 🔴 82,313 — MAJOR RESISTANCE The chart explicitly marks this as the RESISTANCE AREA. This is the major level separating the current bearish structure from a much stronger bullish recovery scenario. 5️⃣ SUPPORT & FVG ZONES 🟩 🟢 75,000–75,500 Immediate psychological/support region. Price is currently testing this area. A sustained hold could produce a short-term bounce. 🟢 73,900–74,100 First major FVG zone shown on the chart. This area could attract price if the 75K support fails. 🟢 73,000–73,700 Second FVG / demand region. This is particularly important because the chart shows multiple inefficiency zones stacked together. A deeper retracement into this area would bring BTC closer to the previous bullish expansion base. 6️⃣ ORDER BLOCK 📦 The chart also identifies an ORDER BLOCK around the lower region near 72K–73K. This area is important because it represents the origin/base associated with the previous strong upward move. If price reaches this region, traders would typically watch for: 📌 liquidity sweep 📌 rejection 📌 bullish displacement 📌 market-structure shift However, simply touching an order block does not guarantee a reversal. Confirmation remains important. 7️⃣ LIQUIDITY ANALYSIS 💧 The recent decline has likely created liquidity around the recent lows. The area below 75K is therefore important. A possible sequence could be: 75K support → liquidity sweep → bounce → resistance test or: 75K break → continuation → FVG fill → deeper demand test The chart's projected path visually suggests a temporary upward retracement followed by another bearish leg. That projection should be treated as a scenario rather than a certainty. 8️⃣ POSSIBLE BEARISH SETUP 🔻 The chart's projected movement suggests: Current zone → relief bounce → resistance rejection → downside continuation A technically cleaner bearish confirmation would be: BTC holds/reclaims a nearby support. Price bounces toward 76.8K–77.3K. Price fails to break the resistance. A lower high forms. Price breaks the local consolidation low. Downside targets become the FVG zones. Potential downside areas: 🎯 TP1: 74.1K 🎯 TP2: 73.5K 🎯 TP3: 73.0K 🎯 Extended: 72K–73K order-block region These are chart-based levels, not guaranteed targets. 9️⃣ BULLISH ALTERNATIVE 🟢 The bearish thesis becomes weaker if BTC starts reclaiming resistance. A potential bullish sequence would be: 75K hold → higher low → 77K reclaim → 78K–79K breakout → 80K test The important thing is not simply a wick above resistance. I'd look for 2H candle acceptance above the level and follow-through. A sustained reclaim of the descending structure would indicate that sellers are losing control of the short-term trend. 🔟 INVALIDATION / CONFIRMATION ⚠️ 🔻 Bearish confirmation A rejection from 76.8K–78K followed by a break below the current 75K consolidation would strengthen the bearish continuation scenario. 🟢 Bullish confirmation A sustained reclaim of 78K–79K followed by a break of the descending resistance structure would weaken the bearish setup. 🚨 Major structural level 82,313 remains the major resistance marked on your chart. 📋 KEY LEVELS Zone Importance Reaction to Watch 82,313 🔴 Major resistance Breakout / rejection 79.5K–80K 🔴 Supply Rejection or reclaim 78K–79K 🔴 Resistance Structure confirmation 76.8K–77.3K 🟠 Near resistance Relief-bounce rejection 75K 🟡 Current support Hold / breakdown 73.9K–74.1K 🟢 FVG Reaction / bounce 73K–73.7K 🟢 FVG Demand reaction 72K–73K 🟢 Order block Potential deeper demand 🧠 FINAL MARKET MAP Above 78K–79K: ➡️ Bearish pressure starts weakening ➡️ 80K becomes relevant ➡️ 82.3K remains major resistance Between 75K–78K: ➡️ High-volatility decision zone ➡️ Relief bounce remains possible ➡️ Watch for lower-high formation Below 75K: ➡️ Downside continuation becomes technically more relevant ➡️ 74.1K FVG becomes the next area to monitor ➡️ 73K–73.7K becomes deeper demand 🎯 OVERALL CHART BIAS 🔻 Bearish while price remains below the major resistance structure. The most important thing on this chart is not to chase the current drop. The cleaner technical confirmation would come from either a bounce into resistance followed by rejection or a confirmed breakdown of 75K support. ⚠️ Educational technical analysis only — not financial advice. Use appropriate risk management and wait for confirmation before taking a trade.

    TITradingView Ideas
  13. Follow-up16 Sept, 08:47

    Bitcoin Long-Term Analysis: Stop Overcomplicating Your Charts

    https://www.tradingview.com/x/4zxxbQ0p/ Trading analysis doesn’t always need ten indicators, five different opinions and a chart full of signals. Sometimes, two trendlines, a Fibonacci retracement and a logarithmic chart are enough to build a long-term plan . That’s exactly what we’re looking at here with Bitcoin on the monthly chart. 📈 Start With the Bigger Picture For a long-term Bitcoin analysis, I prefer looking at the market on a logarithmic chart . The idea here is deliberately simple. Connect the major highs with a trendline. Then clone that trendline and move it down toward the major lows. That gives us a broad long-term structure in which Bitcoin has historically been moving. No complicated indicators. No prediction model. Just price, structure and perspective. 📐 Now Add Fibonacci Next, we add a Fibonacci retracement across the larger market move. This gives us several important areas to watch: 0.236 — around $77,622 0.382 — around $57,132 0.500 — around $44,597 0.618 — around $34,812 0.786 — around $24,466 These levels are not predictions. They are not telling us that Bitcoin has to trade at $57K, $44K or $34K. They simply give us predefined areas where we can pay closer attention and reassess the market if price gets there. 👀 Don’t Ignore the 0.236 Level Because we are looking at a monthly long-term chart , even the 0.236 Fibonacci level deserves attention. A relatively shallow retracement on such a large timeframe can still represent an important area in the broader structure. That’s why I wouldn’t automatically wait for Bitcoin to reach the deeper Fibonacci levels before doing anything. The market might never give us those prices. And that’s completely fine. 🎯 The Levels Are a Plan — Not a Prediction This is probably the most important part of the entire analysis. Imagine you already have Bitcoin exposure. If Bitcoin continues higher from here, you participate in that move. If Bitcoin instead enters a larger correction, you already know which areas you want to watch. Around $57K? Reassess. Around $44K? Reassess again. Around $35K? Another predefined area to evaluate. Whether any of those levels will actually be reached is impossible to know in advance. That isn’t the point. The point is that you don’t have to start making emotional decisions if Bitcoin suddenly drops. You already have your map. 🧠 A Falling Market Doesn’t Have to Create Panic A major correction looks very different when you have already thought about it before it happens. Instead of: “ Bitcoin is crashing — what should I do? ” the question becomes: “ Bitcoin has reached one of the areas I identified beforehand. Has the market given me a reason to consider adding exposure here? ” That small change in thinking makes a big difference. Lower prices aren’t automatically buying opportunities. Market structure can change, support can fail and every level still needs to be reassessed when price actually reaches it. But being prepared means you’re responding to the market rather than reacting emotionally to it. 🔑 Stop Looking for Someone Else’s Prediction There will always be another Bitcoin prediction. $150K. $50K. $250K. $30K. Someone will always have another target. But you don’t need thousands of analyses telling you where Bitcoin supposedly goes next. Learn how to build your own map . A logarithmic chart. Two trendlines. A Fibonacci retracement. And predefined areas where you know you’ll reassess the situation. That can already turn a complicated-looking market into a surprisingly simple long-term framework. 📊 Simple Analysis. Clear Preparation. Will Bitcoin reach $57K, $44K or $35K? Nobody knows. Maybe it reaches one of them. Maybe several. Maybe none. If Bitcoin continues higher, someone who already has exposure can participate in that move. If Bitcoin corrects toward the deeper Fibonacci levels, those predefined areas can become places to reassess the market and potentially consider further entries. That’s the purpose of this chart. Not predicting the future. Preparing for it. And that’s exactly the kind of market analysis worth learning: understanding how to use simple tools correctly, identify your own areas of interest and prepare for different market scenarios without depending on somebody else’s prediction. Keep the chart simple. Build the plan before you need it. 🎓 Learn to Build Your Own Analysis This is exactly the kind of analysis we teach: how to use simple tools like Fibonacci levels, trendlines and logarithmic charts to build your own market scenarios . The goal isn’t to give you predictions or tell you what to buy. It’s to give you the knowledge and tools to identify your own levels, understand what the market is doing and prepare for different outcomes before they happen . Because the more you understand the chart yourself, the less you need to depend on someone else’s prediction . This analysis is for educational and informational purposes only and does not constitute financial or investment advice. Fibonacci levels and trendlines are analytical tools, not guaranteed support or entry levels. Cryptocurrency markets are highly volatile and involve substantial risk.

    TITradingView Ideas
  14. Follow-up16 Sept, 08:42

    BITCOIN Clarity Act FAILED. Another Shock-another Top? Fed ahead

    Bitcoin (BTCUSD) saw the Clarity Act failing again and now the market focus shifts towards today's Fed Rate Decision and more importantly Chair Warsh's tone during the Press Conference. In the very probable event that the Fed hikes, if Warsh sets the narrative for more upcoming hikes, those news can act as a catalyst to confirm the technical bias. Which following the 1W MA50 (blue trend-line) rejection, are bearish. In fact, every BTC market Top (and subsequent Lower Highs of the Bear Cycle) since last October, had a similar catalyst (set of macro events/ news) that confirmed the Top and kick-started the bearish reversal and sell-off (technical Bearish Leg) that followed. Notice also that even their 1D RSI patterns have been similar, all starting on overbought (RSI > 70.00) territory. October 2025 was due to the U.S. - China tariff escalation. January 2026 evolved around tariffs leading to massive ETF outflows. May 2026 formed on hot CPI, PPI readings on rising yields. The last two Lower Highs in particular formed a Resistance Zone (red). Similarly the last Lows (June 2026) have formed a Support Zone. This is critical as the first line of defense on this Support Zone is the 1W MA200 (orange trend-line), sitting exactly on its top. As a result, if the Fed confirms today the 1W MA50 rejection, the fair technical Target of a potential new Bearish Leg would be the 1W MA200 at around $66000. A -30.38% total drop, same as May-June, would price that closer to $57200. Do you think the Fed can trigger such drop today or BTC will break and close above its 1W MA50 and confirm the new Bull Cycle? Feel free to let us know in the comments section below! --- ** Please LIKE 👍, FOLLOW ✅, SHARE 🙌 and COMMENT ✍ if you enjoy this idea! Also share your ideas and charts in the comments section below! This is best way to keep it relevant, support us, keep the content here free and allow the idea to reach as many people as possible. ** --- 💸💸💸💸💸💸 👇 👇 👇 👇 👇 👇

    TITradingView Ideas
  15. Follow-up16 Sept, 07:11

    Bitcoin Breaks September Support — Bears Take Control

    b]September Support Gives Way Bitcoin has broken below the key September lows around $76,264, weakening the recent medium-term recovery. That former support now becomes an important area of potential resistance. Lower Highs Continue The breakdown follows Bitcoin's third rejection from the $79,600–$80,000 area in little over a week. This continues the recent sequence of lower highs from the $82,300 peak. Moving Averages Turn Bearish Price is now below the 100/50-period EMAs, with both averages sloping lower and contracting. This adds further weight to the deterioration in the 4-hour trend. Selling Volume Picks Up The break through support was accompanied by two sizeable spikes in selling volume. This gives the breakdown more significance than a low-volume move beneath support would have. Momentum Is Stretched RSI remains below 50 but is not yet oversold, suggesting there could still be room for further weakness. StochRSI, however, is already oversold, so a short-term bounce would not be surprising. Next Area Below Tuesday's low at $74,967 is the immediate level to watch. If that fails, the daily FVG between roughly $73,027 and $70,000 becomes the next broader area of interest. In Summary Bitcoin has lost an important September support after repeatedly failing around $80,000, with increased selling volume adding weight to the breakdown. Price is also below the declining 100/50-period EMAs, while RSI remains bearish below 50. A short-term bounce is possible with StochRSI oversold, but $76,264 may now act as resistance. Unless bulls reclaim that level, attention shifts towards $74,967 and potentially the daily FVG below.

    TITradingView Ideas
  16. Follow-up16 Sept, 07:09

    Is Bitcoin Is Preparing For Its Next Big Drop Or A Rally? $BTC?

    BITCOIN (BTC/USD) 🌍 The macro narrative heading into this week is heavily shaped by heightened macroeconomic caution as markets digest sticky global inflation metrics, elevated U.S. Treasury yields, and central bank interest rate decisions 🏦. Interestingly, general online sentiment is heavily leaning bearish amid lower liquidity concerns and ETF outflows, but widespread social media chatter about a "guaranteed collapse" suggests we are fast approaching a crowded trade, paving the way for a sharp liquidity hunt before any sustained expansion occurs. We are observing a distinctly Bearish Market Structure across key high timeframes, but the lower timeframe (H1) shows price attempting a corrective ascending channel after a heavy Markdown phase 📉. Applying Wyckoffian principles, this tight upward channel appears to be a redistribution flag or a weak corrective pull following a structural breakdown. Retail community chatter is actively attempting to catch a bottom inside this range, which tells me late long traders are likely getting trapped right below key technical overhead. Key Zone: The primary area of concern is centered around the Volume Profile Value Area Low (VAL) at $76,635.25 and the immediate high-volume node at $77,252.41 📉. Auction Market Theory dictates that when price breaks out below a Value Area, it trades in "Discovery Mode." Acceptance back above VAL would signal a failed breakout, but as long as price remains rejected below this $76,635–$77,250 region, the value area remains strict resistance. We are currently trading near the lower boundaries around $75,987, holding below the 1-hour moving average dynamic resistance 🧹. I am watching for a swift "run on liquidity" to sweep late buyers into the supply zone before the next leg down. The chart's annotated "No go zone" around $76,694 highlights the invalidation boundary—if price breaks back into the internal value area, the short thesis is invalidated. My Trade Plan 🎯 Bias: Bearish (Neutral-Short). Exercising strict patience until the corrective channel breaks structure. Entry Protocol: Looking for a corrective push up toward the channel high ($76,400–$76,600), followed by a clear Bearish Break of Structure (BoS) out of the ascending micro-channel and a failed retest of the lower channel boundary to trigger the short entry, targeting a drop toward $74,800.

    TITradingView Ideas
  17. Follow-up16 Sept, 03:07

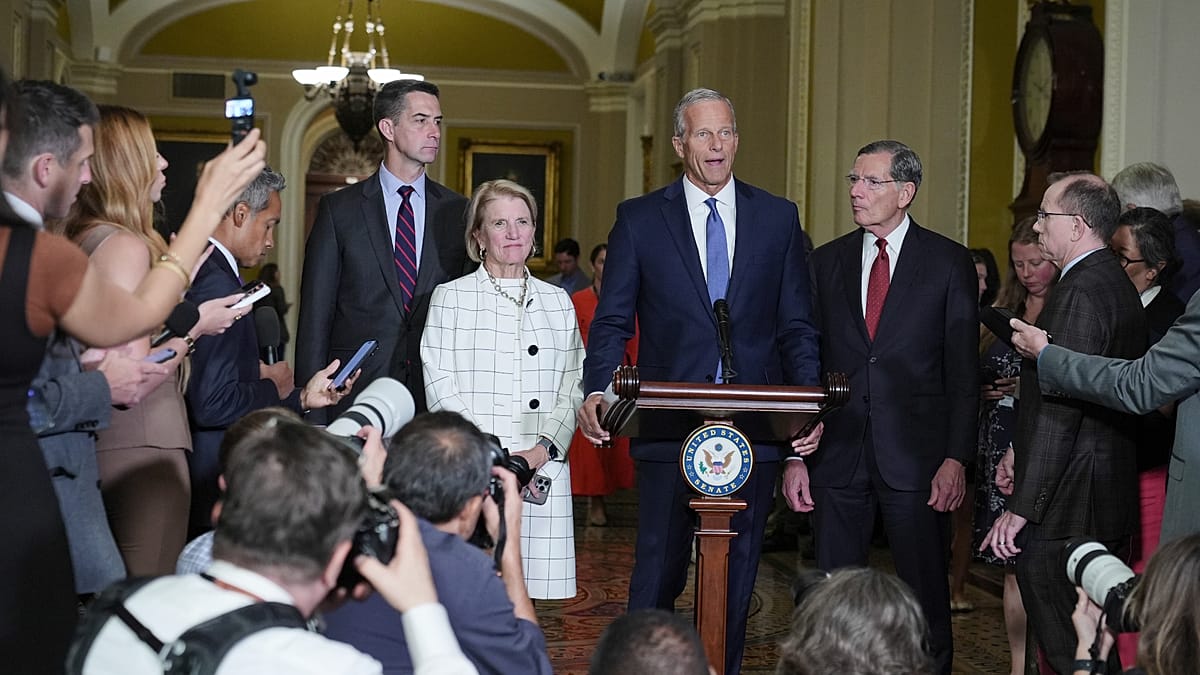
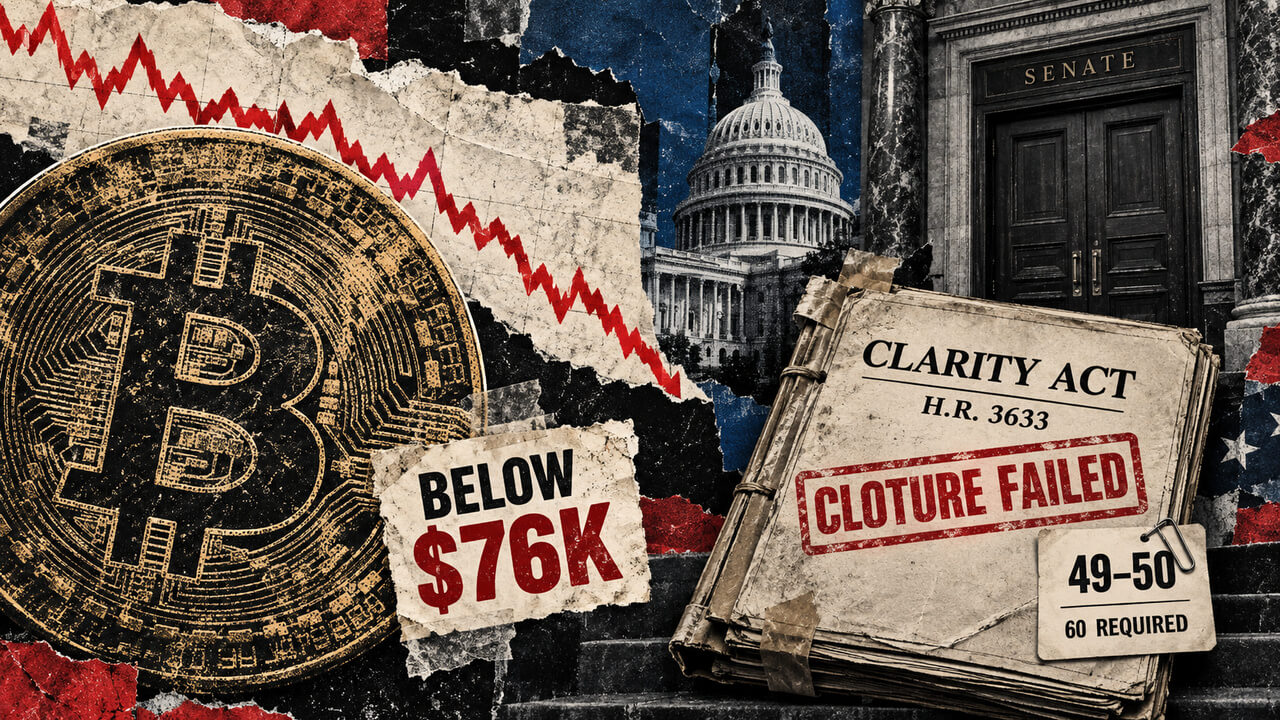
    Senate crypto clarity bill fails cloture vote, bitcoin slides

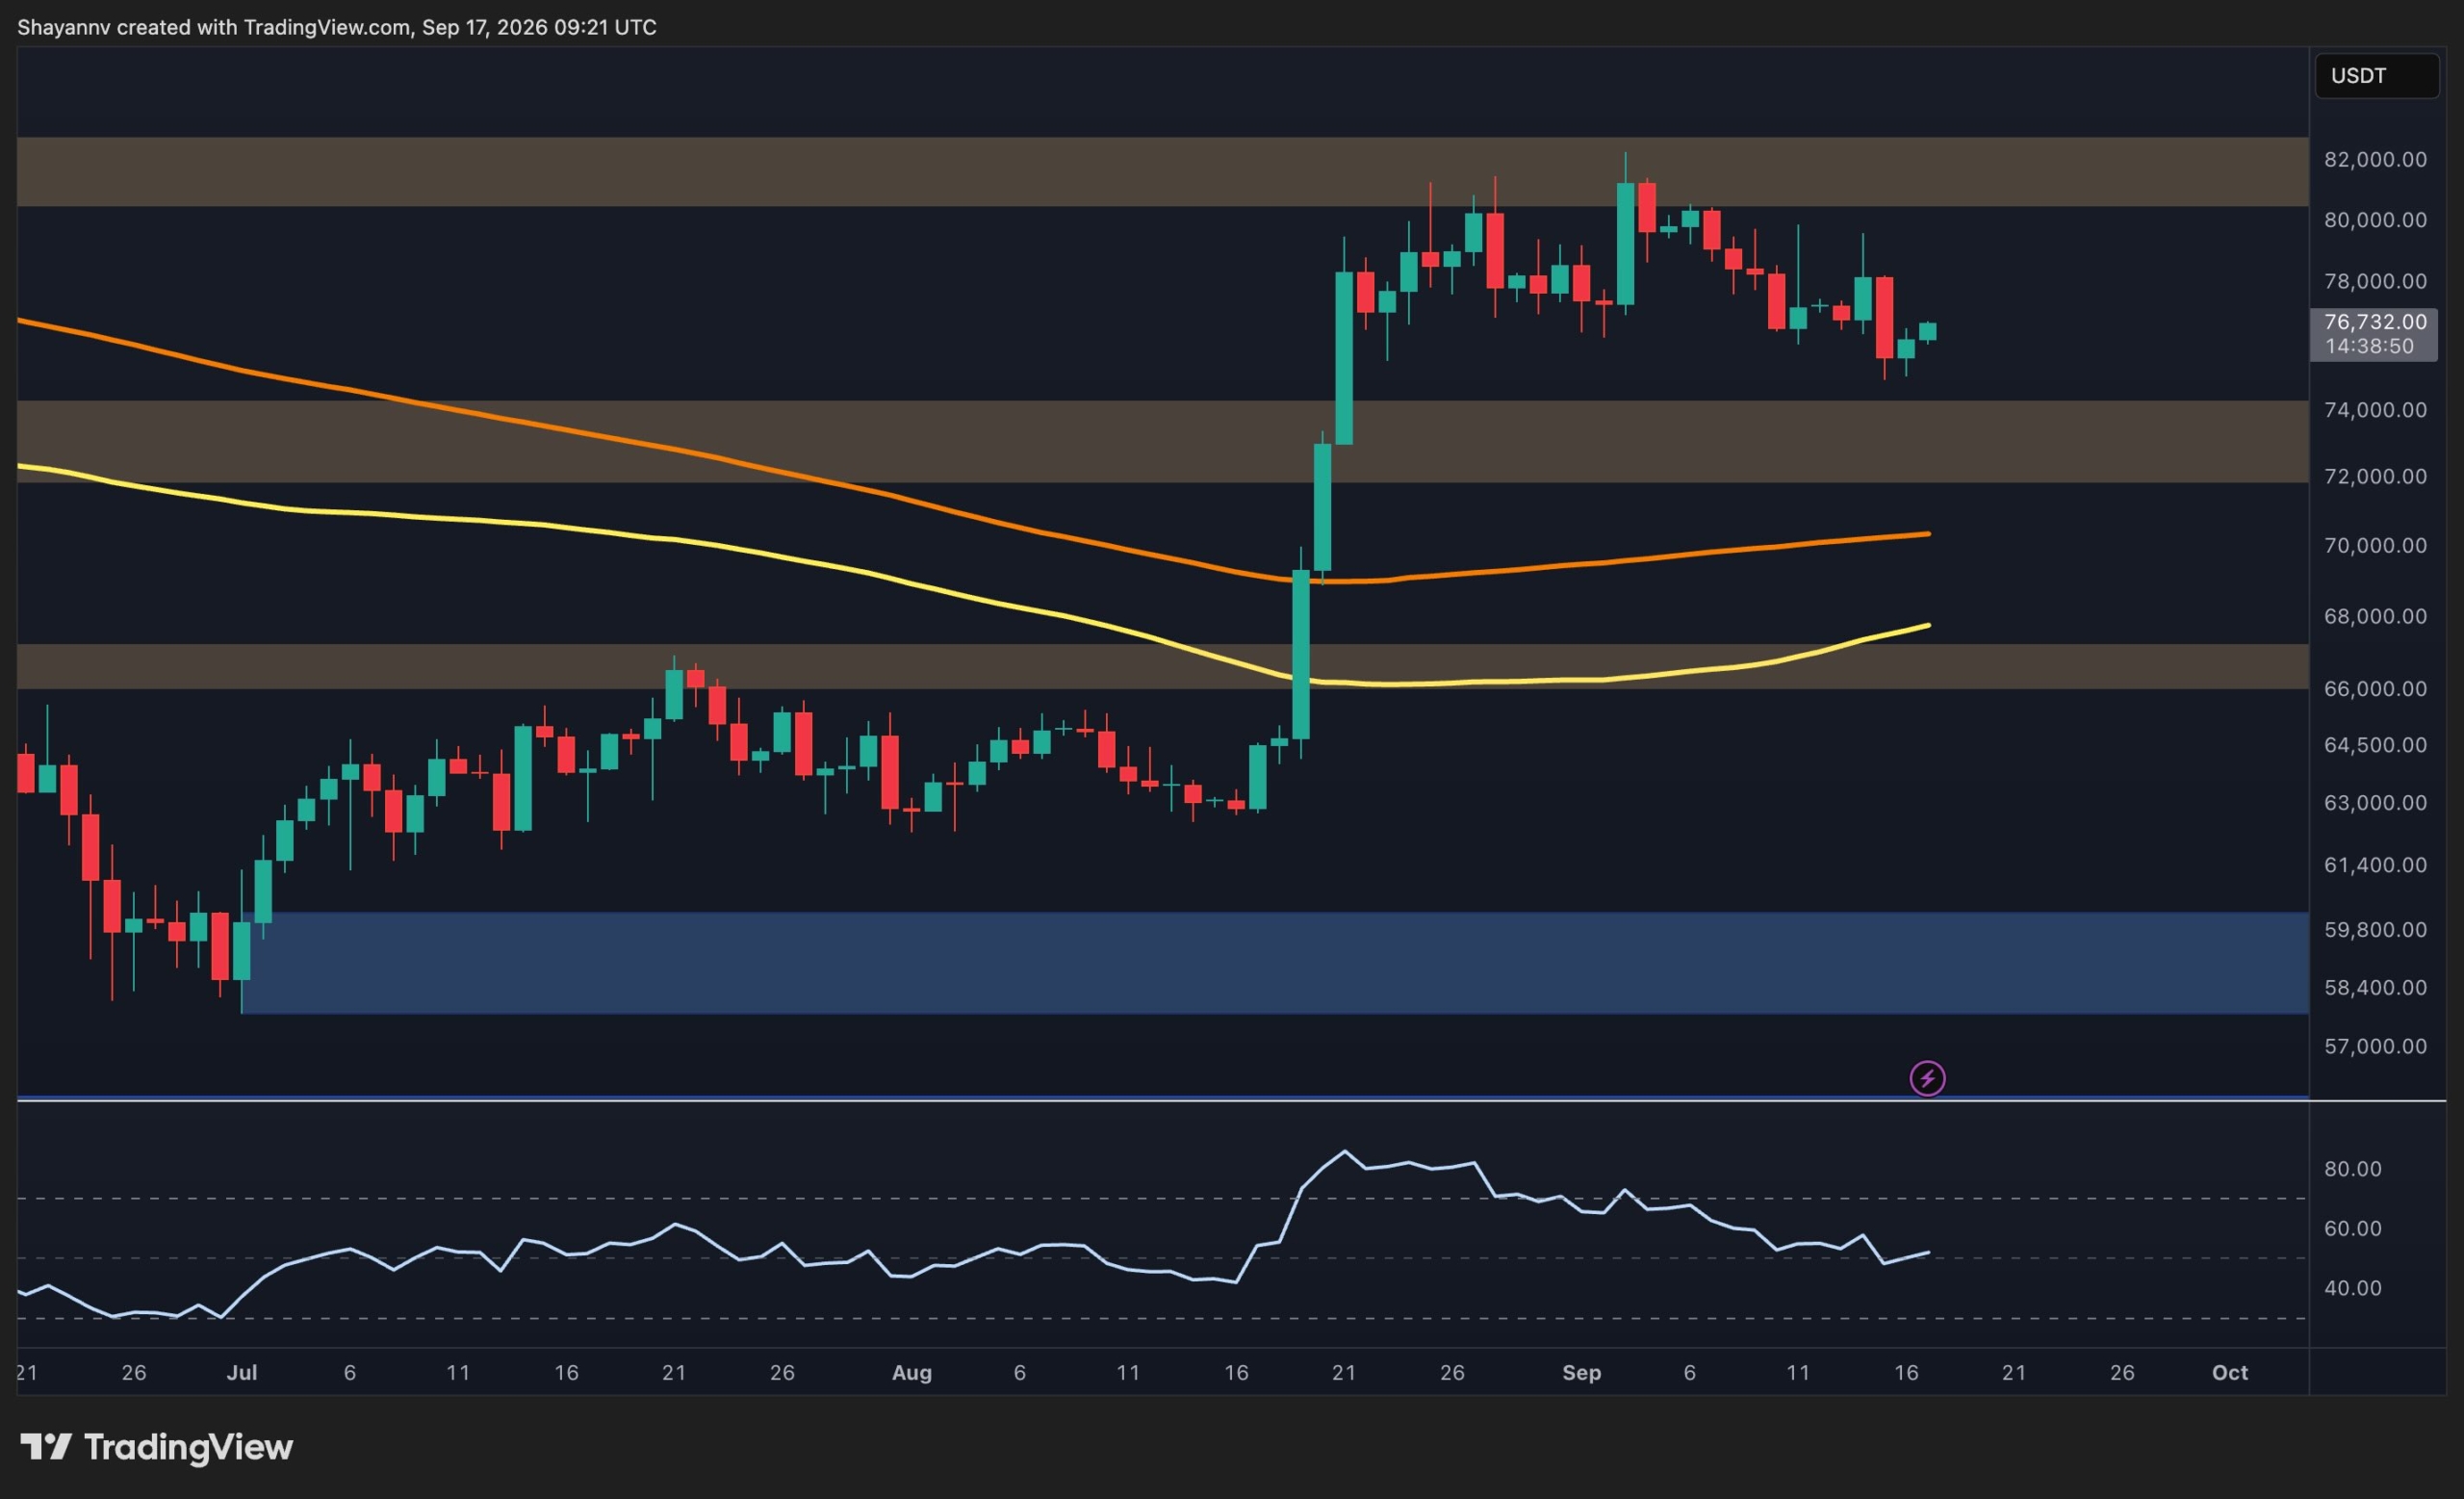
    BTCUSD | 4H Technical Analysis — Sep 16, 2026 Bitcoin is under pressure after the US Senate failed to advance the Digital Asset Market Clarity Act, the comprehensive crypto market structure bill the industry has spent years lobbying for. A procedural vote to bring the bill to the floor fell short 49 to 50, well below the 60 votes needed for cloture, plunging crypto-related stocks including Coinbase and reigniting uncertainty over whether the CFTC will ever gain the unified regulatory authority the industry has been seeking. The sell-off was compounded by broad risk aversion ahead of tomorrow's FOMC rate decision, with markets reluctant to add risk into a binary macro event on top of the fresh regulatory setback. BTCUSD spent nearly three months, June through mid-August, chopping in a wide 58,000 to 67,000 range before a sharp spike in late August drove price directly to 70,000 and beyond, clearing the entire range in a matter of days. That move extended into early September, with price tagging a high near 82,000 before rolling over into a descending channel that has been in place ever since. The channel's upper boundary has capped every bounce near 80,000 to 82,000, while the lower boundary running through 74,300 has held on each retest so far. Price is now trading around 76,000, with the fast EMA at 77,055 just below the slow EMA at 77,626, a mildly bearish signal that reflects the stalling momentum since the early September peak. RSI has fallen to 36.72, its lowest reading since the pre-breakout consolidation in July and August, showing the Senate news and FOMC anxiety are actively pressuring price rather than just causing a pause. The 74,300 level is the one that matters most right now. It is both the descending channel's lower trendline and the same shelf that has provided support on at least two prior tests since the channel formed, making it the clearest line between an orderly pullback and a deeper breakdown back toward the August range. Key levels to watch: Resistance: 78,000 (recently lost support) / 82,000 (early September high) / 86,000 Support: 74,300 (channel lower trendline, prior support) / 72,500 / 70,000 (breakout level from the August range) Bear case: The failed Clarity Act vote removes a key regulatory tailwind the market had been pricing in, and with the FOMC decision still pending tomorrow, positioning is likely to stay defensive. A break below 74,300 would confirm the descending channel is resolving lower rather than consolidating, opening a retest of 70,000 and potentially the top of the old 60,000 to 67,000 range if risk sentiment deteriorates further around the rate decision. Bull case: The Clarity Act failure was a procedural setback, not a permanent rejection, and legislative efforts of this kind typically get reintroduced rather than abandoned outright. If the FOMC decision tomorrow leans dovish or simply removes uncertainty, a bounce off 74,300 back above 78,000 would suggest the pullback was sentiment-driven rather than structural, keeping the broader uptrend from the August breakout intact. Bias is neutral to cautiously bearish while price holds below 78,000, with the FOMC decision tomorrow the more immediate catalyst than the crypto-specific regulatory news. The descending channel and falling RSI both argue for near-term weakness, but 74,300 has held before and remains the level that decides whether this is a routine pullback within an uptrend or the start of a larger correction back toward the summer range.


    TITradingView Ideas
  18. 15 September
  19. Follow-up15 Sept, 19:50

    Quick BITCOIN UPDATE- touched tha 75K mark, what now?

    Main chart is 4 Hour I mentioned a few posts ago that we could reach 75K and we did but we had a very swift recovery from that anf that shows the Bulls are still here. However, we have lost the lower Local line of support and so we could reach down in a more meaningful way to the lower main trend line.....Which will hopefully remain as support. So Lets look at what we have 4 hour RSI https://www.tradingview.com/x/VXWCdI6m/ RSI is NOT Oversold but certainly below Neutral. This shows PA has more strength than weakness maybe This may need to drop further, which can happen while PA ranges. 4 Hour MACD https://www.tradingview.com/x/0hh5moqE/ Also below Neutral with the ability to drop further. Histogram is still Red and so unlikely to turn in the next few hours. The Lower this goes, the more strength PA has to recover Longer term Daily RSI https://www.tradingview.com/x/TyH6cQfA/ This has only just reached Neutral but may not need to drop all the way to OverSold before turning. However, I am not to sure we will see a bouce off Neutral just yet Daily MACD https://www.tradingview.com/x/u37uPvPI/ This is the one that Give it all away for me. MACD ( yellow) has not reached Neutral just yet and so this needs to continue to Drop Again, this can happen while PA ranges Horizontal , so a Drop is not certain. CONCLUSION While we wait fo the FED Rate Rise, which is almost certain,, PA could remain at this Low zone, maybe reaching once again down to the lower trend line, While we wait for MACD and RSI to Cool off A reminder, that trend line is based in 2013 and is STRONG, in fact, Both Orange lines and the fainter blue line above are based in 2013 Bitcoin is in a GOOD POSITION and this move maybe the Bulls Pricing in the expected Rate Rise. And as I have shown in Previous posts, Bitcoin Does NOT always Drop if Rates Rise..... And I sall show that again after the FED meeting. Umtil then, hang tight, Options are Varied and things likely to remain Volatile

    TITradingView Ideas
  20. Follow-up15 Sept, 17:25

    FOMC Is Testing Gold and Bitcoin Differently: XAUUSDT vs BTC

    FOMC Is Testing Gold and Bitcoin Differently: XAUUSDT vs BTC One macro catalyst can create very different setups across TradFi and crypto. With the FOMC decision approaching, oil remains above $100 while US Treasury yields are elevated. That creates a difficult environment for both gold and Bitcoin, but the way they respond to rates and risk sentiment is different. 🟡 XAUUSDT My Selected Setup Gold is currently trading around $4,290, caught between safe-haven demand and pressure from higher yields. The key area I’m watching is $4,267 support. I don’t want to chase the current price. My preferred setup is a liquidity sweep into $4,267–$4,285 followed by a bullish reclaim. Long idea: $4,270–$4,285 after confirmation Invalidation:Clean break below $4,253 Target 1:$4,300–$4,318 Target 2: $4,330 Target 3: $4,355 If buyers reclaim $4,300–$4,318 and hold it after the FOMC volatility, the upside structure becomes much stronger. If $4,253 breaks decisively, I would abandon the long thesis and wait for a lower setup. 🔵 BTC Supporting Comparison BTC is also sensitive to the FOMC, but its reaction is more closely tied to liquidity and overall risk appetite. I’m watching the $75K–$76K support zone. A reclaim of $77K–$78K after the FOMC reaction would improve the short-term structure, while losing $75K would keep downside pressure elevated. 📊 Why XAUUSDT Has the Cleaner Setup For this catalyst, I prefer Gold because the relationship between Fed policy → yields → USD → gold gives me a clearer framework. BTC adds another layer through broader crypto risk sentiment. So my plan is simple: No pre FOMC chase. Wait for the liquidity sweep, then trade the confirmation. The reaction matters more than the headline. This is my market analysis and trading plan, not financial advice.

    TITradingView Ideas
  21. Follow-up15 Sept, 16:07

    Bitcoin — $76K Decision: Recovery or Breakdown?

    ₿ Bitcoin has been trading inside a broad range after the previous recovery, but the latest rejection from the upper part of the structure has pushed price back toward a major demand zone. Price is now testing the lower edge of the range around the $75,500–$76,500 area. This is a critical decision point: holding it could trigger another recovery, while a clean breakdown would expose the deeper kink zones below. 🏆 Previously: https://www.tradingview.com/chart/BTCUSD/hV40i9wz-Bitcoin-The-Range-Is-Setting-Up-for-Its-Next-Break/ 📈 Bullish scenario The current zone around $75,500–$76,500 is the main area buyers need to defend. Price has repeatedly reacted around this region, making it an important base for another potential recovery. If BTC holds this zone and starts reclaiming the nearby range, the first major target would be the upper resistance around $82,000–$82,800. A clean breakout above that zone could open the door for another bullish expansion. Demand hold → range reclaim → $82K+ breakout watch. 📉 Bearish scenario The immediate risk is a confirmed breakdown below $75,500, which would weaken the current range structure and suggest that sellers are taking control. If the breakdown continues, the first major area below is the $71,100–$72,000 kink. Losing that zone could expose the next kink around $69,000–$69,700, creating room for a much deeper bearish move. $75.5K breakdown → $72K kink → $69K test. 🎯 Outlook Bitcoin is sitting directly on a major decision zone after being rejected from the upper part of the range. The $75,500–$76,500 area is now the key defense for the bulls. Holding this zone keeps the recovery scenario alive and puts $82,000–$82,800 back in focus. But if BTC loses the zone decisively, the $71,100–$72,000 kink becomes the next major area to watch. Hold $75.5K–$76.5K → bullish recovery remains possible. Reclaim the range → $82K–$82.8K becomes the next target. Break below $75.5K → deeper downside opens up. Zone test → reaction → $82K breakout or $72K breakdown.

    TITradingView Ideas
  22. 14 September
  23. 11 September