‘Nothing truly structural’: Analysts downplay Clarity Act defeat as bitcoin, major crypto stocks dip
Analysts told The Block that the crypto market will continue to move with interest rates and the broader monetary environment.

Analysts told The Block that the crypto market will continue to move with interest rates and the broader monetary environment.

BTCUSDT is trading around 75,830 USDT after breaking below the 76,300–77,200 support zone. This breakdown was accompanied by strong selling pressure; with the price currently sitting below both the EMA34 (approx. 76,965) and EMA89 (approx. 77,210), sellers remain in control of the H1 market structure. The 76,300–77,200 zone has now shifted into a retest resistance area. If BTC rallies to this region but fails to reclaim the EMA cluster, I lean towards a scenario where the price continues to decline to 75,000, potentially extending to the primary target near 74,200 USDT. Macro factors today also reinforce the bearish outlook. Reuters reported a drop in Bitcoin to around 75,816 USD after the US Senate failed to pass a procedural step for the Clarity Act; meanwhile, the 10-year Treasury yield has surpassed 5%, and the market is pricing in a greater than 90% probability of a 25bp rate hike by the Fed in today's decision. This combination creates a rather unfavorable environment for risk-on assets. The bearish scenario would be invalidated if BTC decisively reclaims the 77,200–77,500 range.

The CLARITY Act could still be revived after Senator Thom Tillis moved to reconsider the failed cloture vote, though industry executives are divided over whether Congress has enough time left.

The Senate's inaction leaves the crypto industry in uncertainty, potentially stifling innovation and complicating future regulatory efforts.

Short Update: **Macro Shift & SEC Catalyst** The failed CLARITY Act vote triggered My**Scenario B**, forcing a direct flush into our **$68,000–$72,000 Golden Zone** (Fib 0.50–0.74 + CIMA Support) to wipe out overleveraged longs. With Congress stalled, SEC Chairman Paul Atkins' proposed executive framework acts as the catalyst for institutional capital to absorb panic selling. **Recovery Profiles** * **V-Bottom Reversal:** Violent bounce off $68k–$72k driven by institutional bids. * **Sideways Base:** Temporary consolidation inside the Golden Zone to absorb supply before expanding toward **$100k+**. **Buy Confirmation Rules (SHM 63 WMA)** Price may drop below the SHM 63 WMA during the flush. **Do not front-run the dip.** Enter only when price reclaims the 63 WMA via: 1. Reclaim + official **SHM BUY signal**. 2. Full candle close back above the **63 WMA**. 3. Clean break and successful **retest hold** of the 63 WMA. **Bull Failure Level** A daily close below **$63,000 and CIMA MA support** paired with an official **indicator SELL signal** confirms a complete failure of the macro bull scenario into a bear market structure. Good Night & GOD BLESS

With today's CLARITY Act not passing in the Senate, uncertainty and risk have entered the market once again. When this happens, one of my favorite things to check is stablecoin dominance, specifically Tether dominance (USDT.D), since it remains by far the largest stablecoin by marketcap. Reviewing the Last Idea To begin, I recommend going back through some of my recent USDT.D posts, but I want to build directly off this one: https://www.tradingview.com/chart/USDT.D/e5etwisP-USDT-D-More-Cash-to-be-Deployed/ In that post, I was pointing out how Tether dominance had reclaimed the channel, suggesting more cash was about to be deployed into the crypto markets, pushing USDT.D lower. Since then, things have changed, and I want to outline exactly what that looks like now. The Primary Channel First, take a look at this parallel channel. I have been tracking this structure since April of this year: https://www.tradingview.com/chart/USDT.D/YflJoClt-USDT-D-Time-to-Pile-Into-Cash/ This channel has done a phenomenal job marking significant highs and lows, and what it has just done structurally is important to pay close attention to. Dominance first broke back into the channel, after trading above it for a while, on August 21, 2026. USDT.D respected being back within the channel boundary, with several daily rejections below its upper line. Then, right at the beginning of September, USDT.D attempted to break back above the channel but failed, resuming respect for the upper boundary as resistance once again. However, on September 9, 2026, something changed. Dominance decisively broke out back above the channel, and for the past week USDT.D has used the upper boundary of the parallel channel as a launching point to move to the upside. What This Means Going Forward Therefore, market participants are likely to continue this momentum by converting crypto back into cash. Given this breakout, the move will bring USDT.D back toward my green line around 8.15% to 8.25%. It is difficult to say exactly where this would put Bitcoin, but it would most likely be sub $70,000, so stay very vigilant heading into this. Why the Structure Supports This Move Another reason this breakout looks compelling for Tether dominance is where the recent lows formed. Many of those lows occurred right around old resistance from November 2021 (red arrow), which has now flipped into new support around the 6.75% dominance level (green arrows). The MACD is also looking very strong and is likely to have a similar move to the two previous moves I have outlined with black arrows. From a structural perspective, this setup looks strong for a push back toward the levels outlined above. The FOMC decision is tomorrow, so brace for significant volatility.
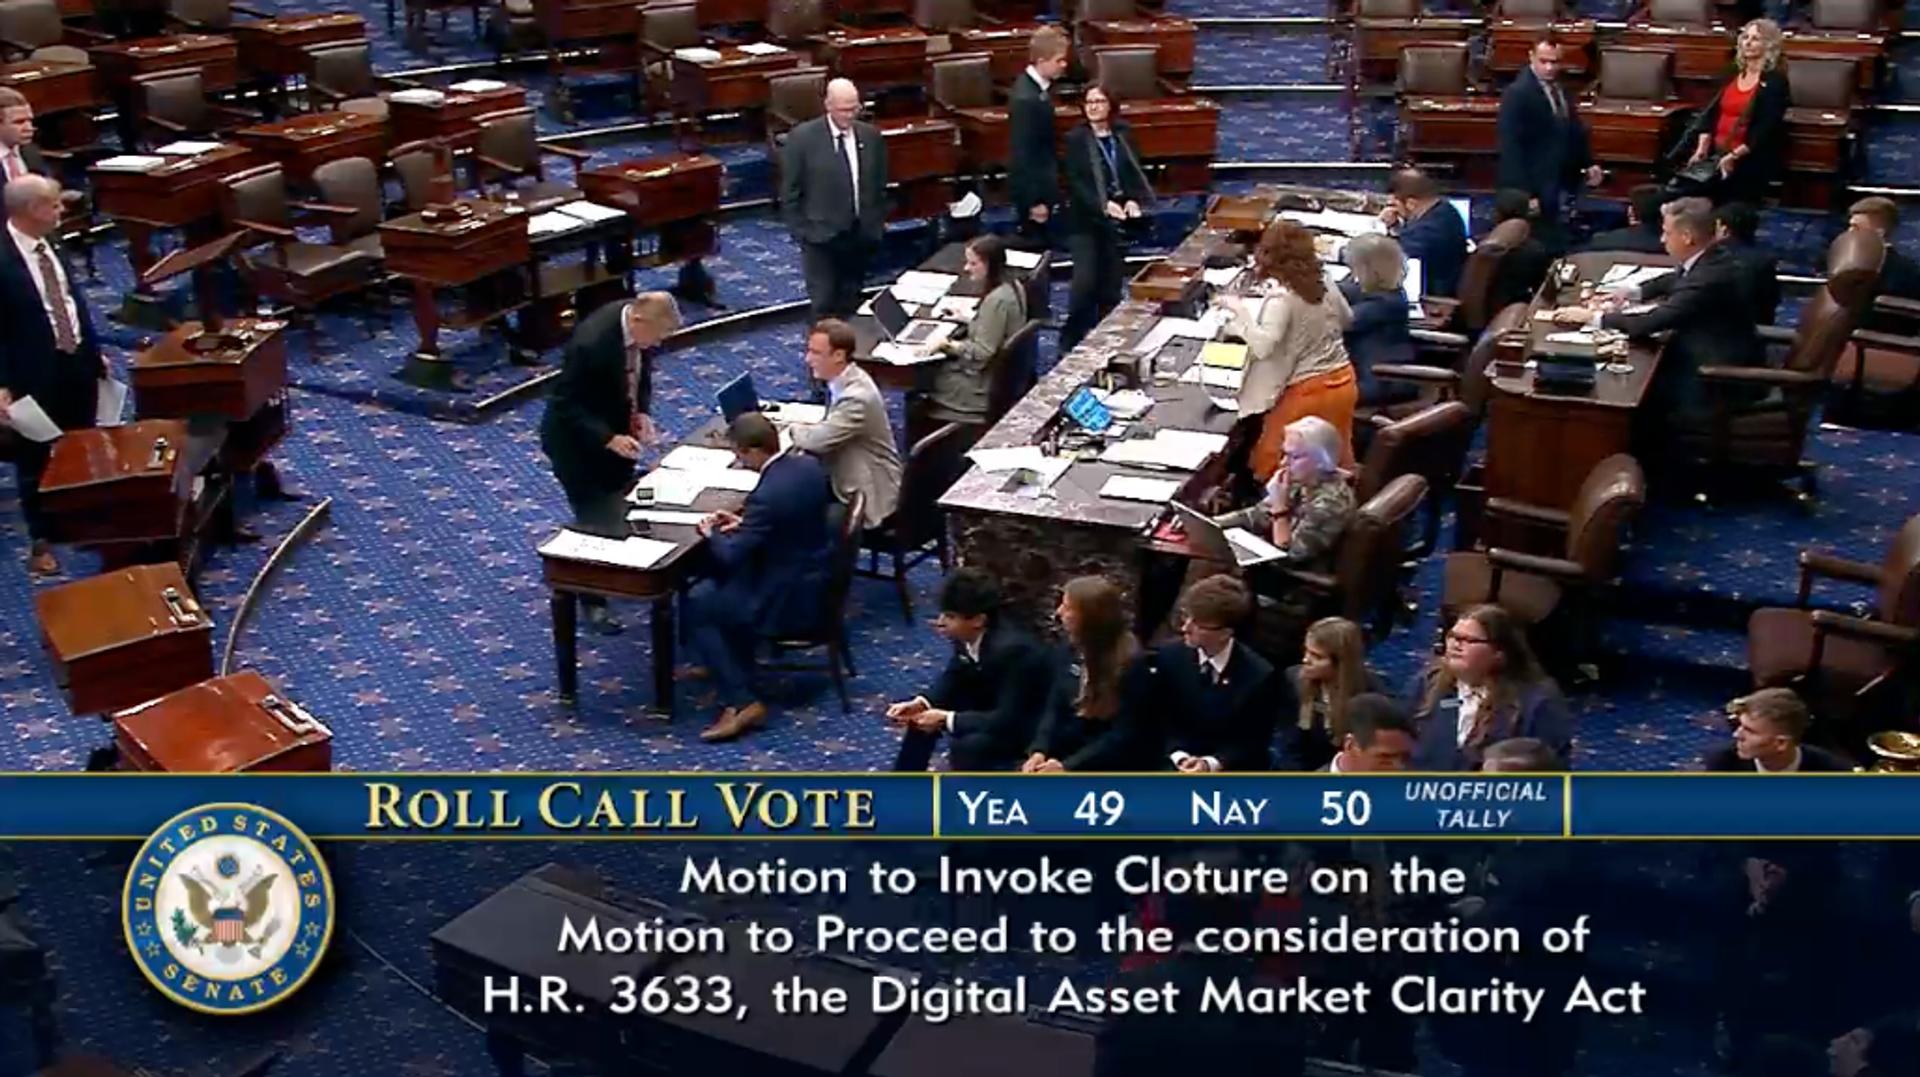
The CLARITY Act failed to advance in the US Senate on Tuesday, September 15, dealing a major setback to the crypto industry’s biggest regulatory push in years. Senators voted 49-50 on a procedural motion to move forward with the bill. It needed 60 votes. The vote was on whether the Senate should begin considering the

Right now, ETH bulls are facing their last line of defense at $2,355. If this level is lost, ETH could see a rapid decline of 10% or more. Let me explain. First, what even is this $2,355 level? It comes from the 3-day chart, where it acted as the primary resistance sellers defended before ETH crashed down to the $1,500 low. For reference on how important that level was historically, view this idea: https://www.tradingview.com/chart/ETHUSDT/yPN1Uj14-ETH-The-Battle-Begins/ Now that price is trading above it, buyers have been using this old resistance as a new level of support. This is clearly visible in ETH's recent lows on Coinbase. The first low after the major pump was established on August 23rd around $2,355.82. Then on September 2nd, price created a double bottom at $2,355.20. Today, with the CLARITY Act failing, ETH reached a low of $2,356.82, giving ETH a current triple bottom structure right at this level. However, if price cannot continue holding these lows, there is very little support between here and $2,150. If that level is reached, it becomes increasingly likely ETH goes lower still, something I will address in a future post if that scenario develops. The Trendline That Has Called Every Top Now for the real substance of this post. Let's dive into the black trendline and all the red X's outlined on the chart. This is arguably the most important thing to watch on ETH's daily timeframe, and it is likely to remain significant for the rest of this market cycle. I have this trendline drawn from the beginning of February 2026, and it has played the most significant role in marking ETH's tops throughout this entire price range. This is not a random line drawn after the fact. It is one I have been tracking and referencing for months. If you are surprised by how many times ETH has topped at this exact trendline, I highly recommend going back and reviewing some of my past work where it was outlined in real time. I first identified this trendline on May 5th as the upper boundary of a rising wedge scenario: https://www.tradingview.com/chart/ETHUSDC/bR1yw8lf-ETH-Both-Scenarios/ It then reappeared as the top of a bear flag I outlined here: https://www.tradingview.com/chart/ETHUSDT/gITAatsV-ETH-How-this-Drop-was-Predicted/ I extended it again to project where a local high was likely to form as ETH was rallying sharply to the upside in this idea: https://www.tradingview.com/chart/ETHUSDT/mTed2jNt-ETH-Where-the-Next-Local-High-Could-Form/ And finally, I extended both trendlines forward to current price action in this idea: https://www.tradingview.com/chart/ETHUSDT/cdDKsyGD-ETH-LTF-Signs-of-Weakness/ Why the Break Would Be So Important This is incredible market structure to see developing, because it strongly suggests this trendline reflects a level algorithmic and institutional players are actively using as a decision point. The more times a level gets respected without breaking, the more significant the eventual break becomes, since it likely triggers a wave of stop losses and trapped short positions all at once once it finally gives way. Because this trendline has correctly called nearly every one of ETH's local tops since February, a daily close above it would represent a genuine and clear shift in trend direction. Once that close occurs, it becomes highly likely that the true bull market for ETH has begun. So although the short term outlook does not look great if $2,355 breaks, keep a close eye on that upper trendline. Once it finally breaks, that is when it will be time to celebrate. I have also added all of the Fibonnaci levels for the current trend to watch if price does start dropping to the downside. I hope this brings you some educational value today.

As I have said repeatedly, I fully expect price to move lower. Rather that be in a minor retracement, or a larger move to a new local low. I also mentioned last night that I thought the clarity act was going to fail and thus cause price to fall. As of now, that is exactly what has happened. Looking at the structure being carved out, I can easily count 3-waves lower from our recent local top. This move lower needs to continue with strength to be considered a wave iii and give the turquoise a chance to fill out. To start chopping without filling out a wave iii gives the white count great credence. We will have to wait to find out, but imo, it is the white and turquoise counts that have the highest probability of filling out. P.S - Just a reminder, orange can apply to both white and turquoise. It is merely stating that this could be the longer-term bottom before wave III begins. Wave III will send price to the moon.

Grayscale says the crypto industry is still making progress despite the Senate’s failure to advance the CLARITY Act to formal debate. The asset manager pointed to ongoing work at the SEC and CFTC while reaffirming its support for comprehensive digital asset rules. Grayscale Points to Regulatory Progress After Senate Vote Grayscale is looking beyond Congress […]
The CLARITY Act died 49-50 in the Senate. Ripple and Strategy say XRP and Bitcoin are still legally safe.


A procedural vote to advance landmark digital asset legislation failed spectacularly on Tuesday, leaving the crypto industry crushed.

Bitcoin Magazine Bitcoin, BTC-Related Stocks Tumble After Senate Blocks Clarity Act Bitcoin’s price tumbled — along with crypto-related stocks — following the blockage of the long-awaited Clarity Act. The price of the leading cryptocurrency recently stood at $75,939, down 4% over the past day, after dropping as low as $75,038 at one point on Tuesday. Lawmakers blocked the landmark digital asset market structure bill in a […] This post Bitcoin, BTC-Related Stocks Tumble After Senate Blocks Clarity Act first appeared on Bitcoin Magazine and is written by Mathew Di Salvo .

The Coinbase-backed Stand With Crypto will add senators’ votes to its scorecards as it rallies crypto voters ahead of November’s elections.

The CLARITY Act failed to clear a crucial Senate hurdle, although a motion to reconsider could allow lawmakers to hold another vote.

Circle and Coinbase shares fell about 10% as the failed Senate vote weighed on crypto-linked equities, with Bitcoin miners and treasury companies also declining.

The CLARITY Act finally reached its first real Senate floor test Tuesday and promptly hit a wall. Senators voted 49-50 against cloture on the motion to proceed to H.R. 3633, leaving the crypto market-structure bill 11 votes short of the 60 needed to advance. The bill isn’t technically dead, but with Congress racing toward its […]

🧠 Psychology: The market had already bought the hope of clearer U.S. crypto rules. When the CLARITY Act failed to secure the 60 votes needed to advance, that hope did not disappear — but its timeline became uncertain. Longs positioned for a positive catalyst began exiting at once. Fear of missing the rally turned into fear of being the last one holding the position. ⚡ Signal: Bearish. BTC dropped sharply from $79,300 to $74,888 on expanding volume and remains below the 9 EMA ($76,360) and 200 SMA ($77,809). According to CoinGlass, more than $254M in longs was liquidated within one hour; reports also cited a roughly $22.5M Binance long liquidation. Until BTC reclaims $76,360, sellers retain short-term momentum. https://www.tradingview.com/x/bO8EbvYc/ ❓ Is this a cleanup of overcrowded longs — or is the market starting to reprice the 2026 crypto narrative? Personal market commentary, not financial advice.