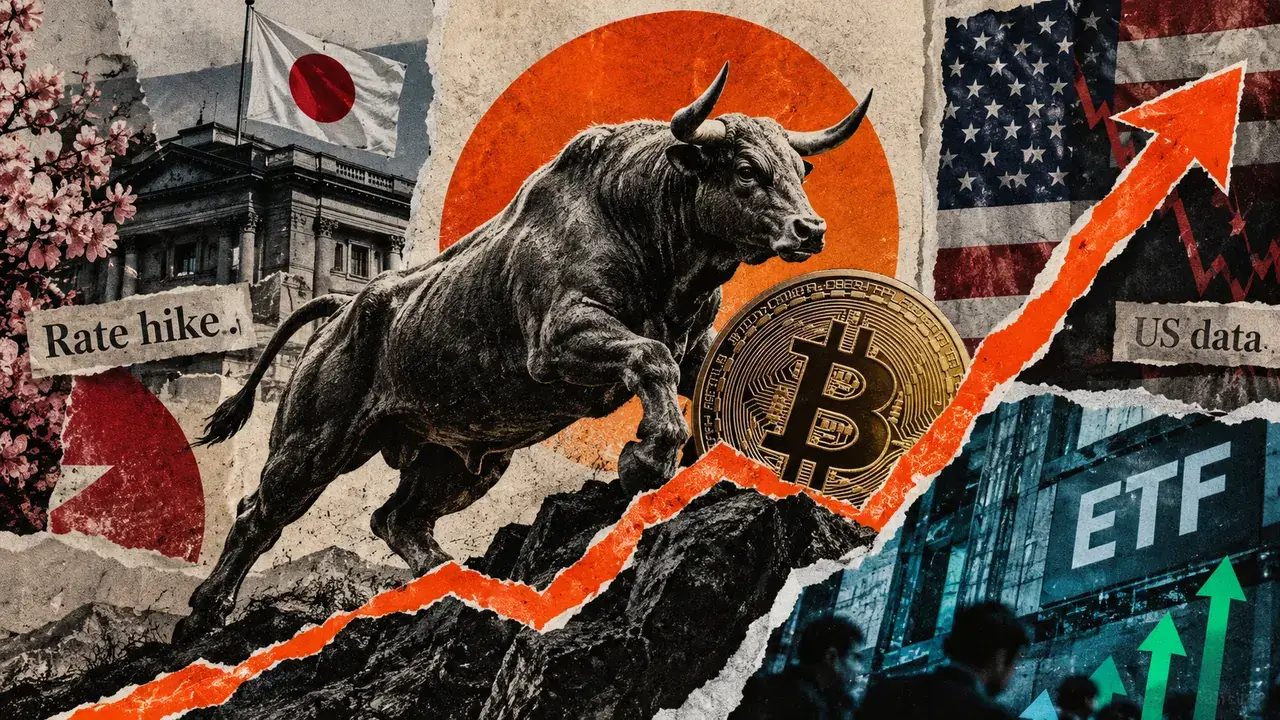
Why Bitcoin hit $80k today hours before bad US data even landed
The September 18 advance accompanied a tech rebound and yen weakness, while prior-session ETF inflows offered a tentative demand signal.
 CryptoSlate•Liam 'Akiba' Wright18 Sept
The September 18 advance accompanied a tech rebound and yen weakness, while prior-session ETF inflows offered a tentative demand signal.
CryptoSlate•Liam 'Akiba' Wright18 Sept
The ETF surge underscores a shift towards cost-effective, flexible investment vehicles, potentially reshaping global asset management dynamics.
 CryptoBriefing•Editorial Team18 Sept
JPMorgan analysts say Bitcoin could see stronger price support than gold if ETF hedging eases, as short interest in BlackRock’s IBIT reaches its highest level of 2026.

XRP open interest fell from $1.128B to $871.22M, but positive funding, ETF inflows and $1.29 support leave the outlook unresolved for traders.

Bitcoin's potential surge, driven by ETF dynamics and short interest, could reshape investment strategies and challenge traditional safe havens.
CryptoBriefing•Editorial Team17 Sept
Bassman's critique of Simplify's governance could prompt increased scrutiny on ETF structures, potentially influencing industry transparency standards.
CryptoBriefing•Editorial Team17 Sept
Bitcoin could get more support than gold if investors reduce their ETF hedges, according to JPMorgan analysts.
 The Block•Yogita Khatri17 Sept
The outflow from Schwab's muni ETF highlights a shift in investor preference towards shorter-duration bonds amid rising Treasury yields.
CryptoBriefing•Editorial Team17 Sept
BlackRock's crypto ETF operations highlight the evolving role of digital assets in traditional finance, impacting market liquidity and investor strategies.
CryptoBriefing•Editorial Team17 Sept
Zoomex expands its TradFi Stock Perpetuals category with SPYUSDT, QQQUSDT, IWMUSDT, XLFUSDT, XLKUSDT, and TQQQUSDT, giving traders Easy to Use, round-the-clock exposure to six of the market’s most closely watched index and sector ETFs. Zoomex, a global cryptocurrency trading platform focused on derivatives trading, has added six new ETF-linked perpetual contracts to its TradFi Stock
 BeInCrypto•Zoomex17 Sept
Two ETF outflow sessions arrived while price stayed near the market mean, setting a specific recovery test.
CryptoSlate•Liam 'Akiba' Wright17 Sept
Until the moment of this update, Bitcoin has still an active whale bullrun cycle, and with data, it shows that ETF whales where able in the 64k+ zone to enter the volume up 72k+ for the cycle, until the moment of today BTC has this bullrun active. Second round? There is huge chance this ETF whales can go for the second round, and when this happen, we can expect a BTC price of 84k+. How we base this data? We base this data since the cycle trend of 2015+ and we use simllair stractures to see if a trend is still into bullrun or not, until now depending on our study BTC is still bullish, and only about time before next breakout.

Zoomex’s TradFi Zone includes a set of ETF-linked perpetual contracts alongside its single-stock and commodity lineup, giving users USDT-margined exposure to broad index, sector, and leveraged ETF products through the same interface used for crypto derivatives. What an ETF perpetual is A traditional ETF gives investors diversified exposure to an index or sector without picking
BeInCrypto•Zoomex16 Sept
The largest crypto, Bitcoin, is trading around $75,700 on Wednesday after another move lower, with BTC briefly falling below $75,000 before recovering part of the loss. The decline follows a combination of the U.S. Senate’s failure to advance the CLARITY Act, heavy ETF outflows and growing caution ahead of the
 TheNewsCrypto•Sarala16 Sept
Bitcoin (BTCUSD) saw the Clarity Act failing again and now the market focus shifts towards today's Fed Rate Decision and more importantly Chair Warsh's tone during the Press Conference. In the very probable event that the Fed hikes, if Warsh sets the narrative for more upcoming hikes, those news can act as a catalyst to confirm the technical bias. Which following the 1W MA50 (blue trend-line) rejection, are bearish. In fact, every BTC market Top (and subsequent Lower Highs of the Bear Cycle) since last October, had a similar catalyst (set of macro events/ news) that confirmed the Top and kick-started the bearish reversal and sell-off (technical Bearish Leg) that followed. Notice also that even their 1D RSI patterns have been similar, all starting on overbought (RSI > 70.00) territory. October 2025 was due to the U.S. - China tariff escalation. January 2026 evolved around tariffs leading to massive ETF outflows. May 2026 formed on hot CPI, PPI readings on rising yields. The last two Lower Highs in particular formed a Resistance Zone (red). Similarly the last Lows (June 2026) have formed a Support Zone. This is critical as the first line of defense on this Support Zone is the 1W MA200 (orange trend-line), sitting exactly on its top. As a result, if the Fed confirms today the 1W MA50 rejection, the fair technical Target of a potential new Bearish Leg would be the 1W MA200 at around $66000. A -30.38% total drop, same as May-June, would price that closer to $57200. Do you think the Fed can trigger such drop today or BTC will break and close above its 1W MA50 and confirm the new Bull Cycle? Feel free to let us know in the comments section below! --- ** Please LIKE 👍, FOLLOW ✅, SHARE 🙌 and COMMENT ✍ if you enjoy this idea! Also share your ideas and charts in the comments section below! This is best way to keep it relevant, support us, keep the content here free and allow the idea to reach as many people as possible. ** --- 💸💸💸💸💸💸 👇 👇 👇 👇 👇 👇

ETH holds near $2,400 despite the CLARITY Act failure and Fed rate decision. Whale accumulation and ETF inflows point toward a possible breakout to $3,000.

Sponsor-funded seed can swell opening assets before creations, redemptions and persistent capital reveal whether investors followed.
CryptoSlate•Liam 'Akiba' Wright16 Sept
BITCOIN (BTC/USD) 🌍 The macro narrative heading into this week is heavily shaped by heightened macroeconomic caution as markets digest sticky global inflation metrics, elevated U.S. Treasury yields, and central bank interest rate decisions 🏦. Interestingly, general online sentiment is heavily leaning bearish amid lower liquidity concerns and ETF outflows, but widespread social media chatter about a "guaranteed collapse" suggests we are fast approaching a crowded trade, paving the way for a sharp liquidity hunt before any sustained expansion occurs. We are observing a distinctly Bearish Market Structure across key high timeframes, but the lower timeframe (H1) shows price attempting a corrective ascending channel after a heavy Markdown phase 📉. Applying Wyckoffian principles, this tight upward channel appears to be a redistribution flag or a weak corrective pull following a structural breakdown. Retail community chatter is actively attempting to catch a bottom inside this range, which tells me late long traders are likely getting trapped right below key technical overhead. Key Zone: The primary area of concern is centered around the Volume Profile Value Area Low (VAL) at $76,635.25 and the immediate high-volume node at $77,252.41 📉. Auction Market Theory dictates that when price breaks out below a Value Area, it trades in "Discovery Mode." Acceptance back above VAL would signal a failed breakout, but as long as price remains rejected below this $76,635–$77,250 region, the value area remains strict resistance. We are currently trading near the lower boundaries around $75,987, holding below the 1-hour moving average dynamic resistance 🧹. I am watching for a swift "run on liquidity" to sweep late buyers into the supply zone before the next leg down. The chart's annotated "No go zone" around $76,694 highlights the invalidation boundary—if price breaks back into the internal value area, the short thesis is invalidated. My Trade Plan 🎯 Bias: Bearish (Neutral-Short). Exercising strict patience until the corrective channel breaks structure. Entry Protocol: Looking for a corrective push up toward the channel high ($76,400–$76,600), followed by a clear Bearish Break of Structure (BoS) out of the ascending micro-channel and a failed retest of the lower channel boundary to trigger the short entry, targeting a drop toward $74,800.
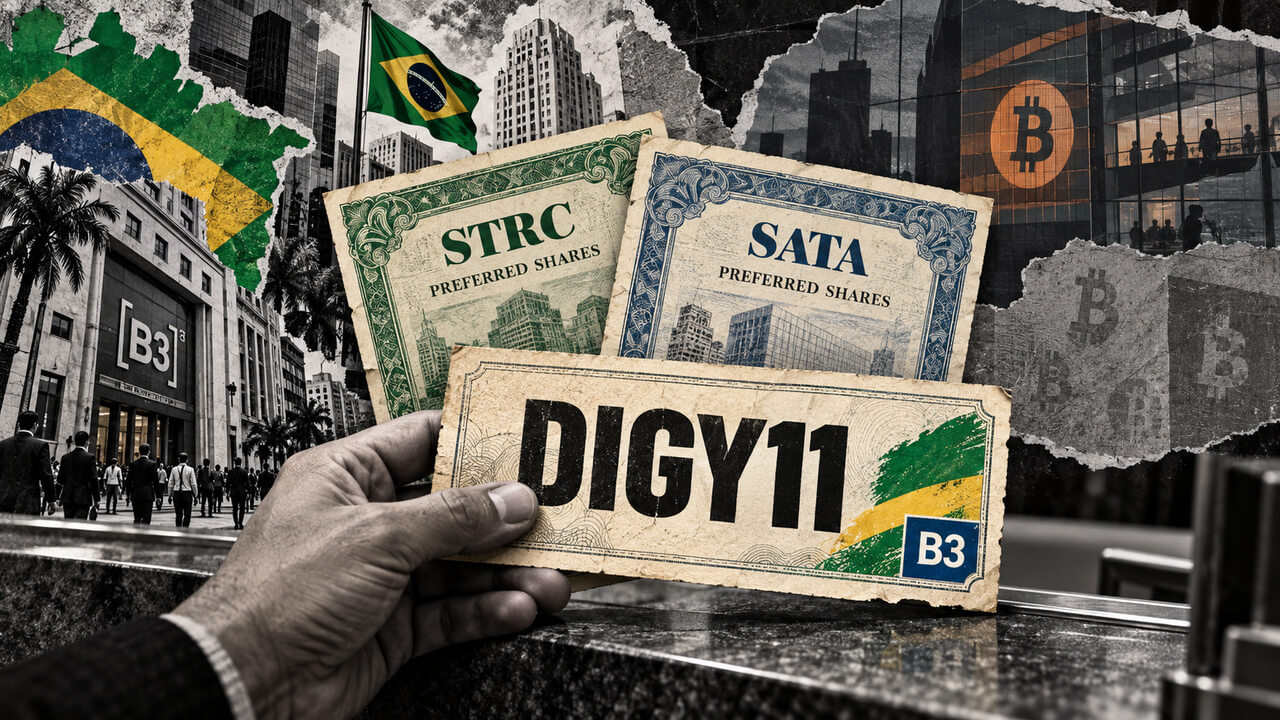
The real-hedged Brazilian fund packages Strategy and Strive preferred shares while leaving distributions and unit returns unguaranteed.
CryptoSlate•Liam 'Akiba' Wright16 Sept
Brazil's innovative ETF could boost crypto investment appeal, but its heavy reliance on a single company's shares poses significant risks.
CryptoBriefing•Editorial Team15 Sept