
Ethereum’s liquidity engine warms up: Should you expect a Q4 risk-on move?
Ethereum sees rising stablecoin liquidity as market flows recover, creating fresh fuel for its risk-on move.
 AMBCrypto•Ritika Gupta16 Sept
Ethereum sees rising stablecoin liquidity as market flows recover, creating fresh fuel for its risk-on move.
AMBCrypto•Ritika Gupta16 Sept
While the S&P, Nasdaq, and Dow sold off following this week's FOMC rate decision, Ethereum held firm. That divergence is a signal. In this breakdown we walk through our two foundational tools, Previous Period High/Low/Mid/Close and PriceMap, to build and stress test a market thesis in real time. Price is holding above its monthly directional, the classic pivot that defines trend bias. With the R level sitting beneath the market, sentiment reads bullish. As long as the R level acts as a support floor rather than flipping to a resistance ceiling, the uptrend structure stays intact. The near term trigger is the previous week's low. Holding above it, even as broader risk assets sell off, signals underlying strength and keeps the bull case alive. Losing it doesn't kill the thesis, it just shifts the read toward the deeper monthly R level as the next area to reassess risk. Bottom line: this isn't about calling a breakout. It's about knowing exactly where the thesis breaks, and trading with that clarity instead of the noise.

This is why! Now I see a repeat of the May-July 2025 bullish consolidation period, it is the exact same but much better of course. ETHUSDT started to rise then went sideways, then nothing is happening now. Where is the market headed next? Here I am calling for a bullish continuation and for obvious reasons. Why would ETH produced a long-term higher low (June 2026 vs April 2025) to start rising just to produce a lower low next? Support has been confirmed and fully established, a new and higher long-term support base. The market does this in order to reach new highs, to go much farther. Higher support, higher challenges on the way up. We are headed for a new all-time high. ETHUSDT is trading below MA200 on the 2D timeframe. At the same time, the action is happening above EMA89 and EMA144, both of these support long-term growth. As long as ETHUSDT 2D trades above EMA144 & EMA89 ($2,300 & $2,180), we can consider this chart setup hyper-bullish. While the market can be expecting a long-term resolution to the current state of affairs, it can happen that growth starts within days or weeks rather than months as it happened back in 2025. This time, plenty of accumulation is present at the bear market bottom. This period of accumulation can in turn reduce the need for a prolonged duration to the current consolidation phase. All doubt has been removed. The numbers are out. The news is already old. Now that everything is out of the way, regardless of the results and expectations, the Cryptocurrency market will continue growing for sure! (?) We are going up and this is truly only the start. From the bottom we grow. Thanks a lot for your continued support, it is appreciated. Namaste.

One green candle below resistance, and the flock has already misplaced the life jackets. ETH bounced from a low near $2,366 and trades around $2,405. The panic has cooled, but the structure has not reversed: price remains below the 4H 9 EMA at $2,420 and below the level that changes the mood — $2,436. The 4H 200 SMA near $2,370 is holding underneath price. That keeps the pond from breaking, but it does not yet give buyers control. AI Agent read: 4H momentum remains bearish — RSI is 35.1 and MACD histogram is -10.431. Volatility remains normal; the AI Agent does not see an elevated-volatility regime yet. 📍 AI Agent Trade Map Signal: 4H Bearish Trigger: A failed 4H attempt to reclaim $2,436 Target: 🎯 $2,357 Key Resistance: $2,436 Support Zone: $2,357 — candidate support; it needs a reaction, not blind faith If buyers take control: $2,531–2,546 — major supply zone Invalidation: A sustained 4H close above $2,436. The AI bearish reading ends only if RSI closes above 45 or MACD histogram returns to zero or higher. ❓ Is the 200 SMA absorbing the fear — or is this simply a calmer place for sellers to return? The flock quacks. The level answers. Personal market commentary, not financial advice.

Bitcoin and ether whipsawed as the Federal Reserve delivered its first rate hike in more than three years.
 The Block•Kyle Baird16 Sept
I think ETH’s short-term uptrend is likely to continue.

While the retail crowd panics over a minor -8.00% correction, the daily chart shows a textbook institutional accumulation block forming at a highly favorable 1:5.00 risk-to-reward ratio. 🚨 Current Structure: Price: $718.19 Reaction: Rejected and pulled back -8.00% from its local high of $780.64 on Sep 12/13. Pattern: Daily Horizontal Support Range / Accumulation Block. Bias: Bullish as long as the $679.23 key support floor holds. "The Level That Decides Everything": The $690.48 - $679.23 Daily Buying Order Block. Bids are queued at the $690.61 entry price. If this floor holds on a retest, it confirms a strong trend reversal to clear local range resistance. A daily close below $675.61 invalidates the setup. Targets: Target 1 at $719.65, Target 2 at $765.61. The Move So Far: Down 8.00% from its local high of $780.64. On the macro scale, CRYPTOCAP:BNB is down 47.77% from its $1,375.11 All-Time High (Oct 2025) and up a massive +1,803,491% from its $0.03982 All-Time Low (Aug 2017). Fundraising Breakdown: Total Raised: $15 Million via public ICO in July 2017. Implied Launch Valuation: $30 Million. Public sale allocation: 50% (100M BNB), founding team: 40% (80M BNB), angel investors: 10% (20M BNB). ICO/IEO Entry Prices: Public sale participants entered at an average price of $0.15 per BNB on Ethereum. ICO buyers are currently sitting on an astronomical ~4,788x return on investment against USD today. Unlock Pressure Ahead: Locked Supply: 0% locked. The final vesting schedule for team and angel investors successfully concluded on July 25, 2021. No lockup cliffs or insider dilution risks remain. Supply Dynamics: Deflationary. Features real-time gas burns (BEP-95) and formulaic Auto-Burns continuously reducing circulating supply toward a target of 100 Million BNB. Key Levels: Resistance 1 / Resistance 2: $719.65 / $765.61 Entry: $690.61 (inside Order Block) Support (range): $690.48 - $679.23 Invalidation / Stop Loss: $675.61 Closing Thesis: BINANCE:BNBUSDT remains one of the safest L1 ecosystem plays, featuring 100% of supply fully unlocked, VC cliff risks at absolute zero, and an active auto-burn mechanism keeping it purely deflationary. Technically, the daily retest of the green order block offers a highly favorable 1:5.00 risk-to-reward ratio for swing traders. If the $679.23 support holds, the path to $765.61 is clear. Below it, the story flips. 🎯 Bullish above $679.23. Below it, the story flips. Not Financial Advice. ALWAYS DYOR.
While the retail crowd panics over a 9% pullback triggered by the Senate's CLARITY Act failure, the daily chart is print-perfect, retesting its primary buying block with an asymmetric 1:4 risk-to-reward setup. 🚨 Current Structure: Price: $2,417.55 Reaction: Rejected and pulled back -9.32% from its local high of $2,665.99 on Sep 12. Pattern: Daily Horizontal Support Range / Accumulation Block. Bias: Bullish as long as the $2,249.71 support floor holds. "The Level That Decides Everything": The $2,326.77 - $2,249.71 Daily Buying Order Block. Bids are queued at the $2,328.22 entry price. If this floor holds on a retest, it confirms a strong trend reversal to clear local range resistance. A daily close below $2,228.22 invalidates the setup. Targets: Target 1 at $2,507.06, Target 2 at $2,728.22. The Move So Far: Down 9.32% from its local high of $2,665.99. On the macro scale, CRYPTOCAP:ETH is down 51.2% from its $4,953.73 All-Time High (Aug 2025) and up over +575,500% from its $0.42 All-Time Low (Oct 2015). Fundraising Breakdown: Total Raised: ~$18.3 Million worth of Bitcoin (approx. 31,591 BTC) in 2014. Implied Launch Valuation: ~$22 Million at genesis. No venture capital rounds or private seed allocations existed prior to the public crowdsale. ICO/IEO Entry Prices: Public ICO finished in September 2014 at an average price of $0.311 per ETH. ICO investors received over 60M ETH. Today, this represents an annualized return on investment of over 270%, or a ~7,773x return on capital. Unlock Pressure Ahead: Locked Supply: 0% locked. 100% of the 122 Million supply has successfully vested. No early founder, team, or foundation cliff allocations remain to dilute holders. Vesting: Fully circulating. New supply enters via programmatic staking validation (~3-6% APR), offset dynamically by EIP-1559 base-fee gas burns. Key Levels: Resistance 1 / Resistance 2: $2,507.06 / $2,728.22 Entry: $2,328.22 (inside Order Block) Support (range): $2,326.77 - $2,249.71 Invalidation / Stop Loss: $2,228.22 Closing Thesis: CRYPTOCAP:ETH ’s near-term price was temporarily hit by Washington’s regulatory gridlock, but the long-term fundamentals of the smart-contract economy remain untouched. Technically, the daily retest of the green order block offers a highly favorable 1:4.00 risk-to-reward ratio for swing traders. If the $2,249.71 support floor holds, the path to $2,728.22 is wide open. Below it, the story flips. 🎯 Bullish above $2,249.71. Below it, the story flips. Not Financial Advice. ALWAYS DYOR.

ETHUSD is currently trading inside a key demand area after an extended bearish move. Price has respected the lower support zone and is attempting to establish a higher low while holding above the rising trendline. The highlighted blue zone represents a short-term accumulation area where buyers appear to be defending price. As long as support remains intact, a recovery toward higher resistance levels remains possible. The main focus is on confirmation from the demand zone and continuation above the ascending structure. A successful breakout from the consolidation range could allow ETH to rotate toward the marked supply zones overhead. 🎯 Target 1: 2460.00 🎯 Target 2: 2495.00 🎯 Target 3: 2550.00 📈 Bullish bias remains valid while price holds above the major support area around 2360.00. Note: This is a market scenario for educational purposes and not financial advice.

The chart shows a strong decline from the $2,587 resistance area. Price is consolidating after the drop, with a possible short-term rebound indicated. Target: $2,455.3 Resistance: around $2,587 The setup remains bullish toward the target only if price holds the current support/consolidation area. Target: 🎯 $2,455.3 This is a technical chart interpretation, not a guarantee of price movement.

In my view buying theta today is like buying ETH in march of 2020. This setup is perfect! I see massive things coming soon. As always stay profitable. - Dalin Anderson

Ethereum appears to have completed a bullish double combination, with the second part of the structure forming as a diametric pattern. If price pulls back into the supply zone, we could see a bearish reaction toward the targets marked on the chart. After reaching these levels, price may enter another corrective phase. The targets are clearly marked on the chart for reference. A daily candle close above the invalidation level would invalidate this analysis. If you have a symbol you want analyzed, first hit the like button and then comment its name so I can review it for you. Do you think Ethereum is bearish?

The Ethereum gacha platform has activated purchases on its V2 protocol, which will run alongside the V1.

U.S. crypto ETFs suffered a broad reversal Tuesday as bitcoin funds recorded $450.33 million in net outflows, their largest daily exit since June 25. Ether ETFs lost another $141.47 million, while solana was the only major category to finish with fresh inflows. Bitcoin ETF Assets Drop Nearly $5B as Bitcoin’s Price Falls Below $76K The […]
 Bitcoin.com News•Emmanuel Musa16 Sept
Bitcoin, Ethereum, and XRP ETFs shed roughly $593 million combined Tuesday, their heaviest single-day drawdown since June.
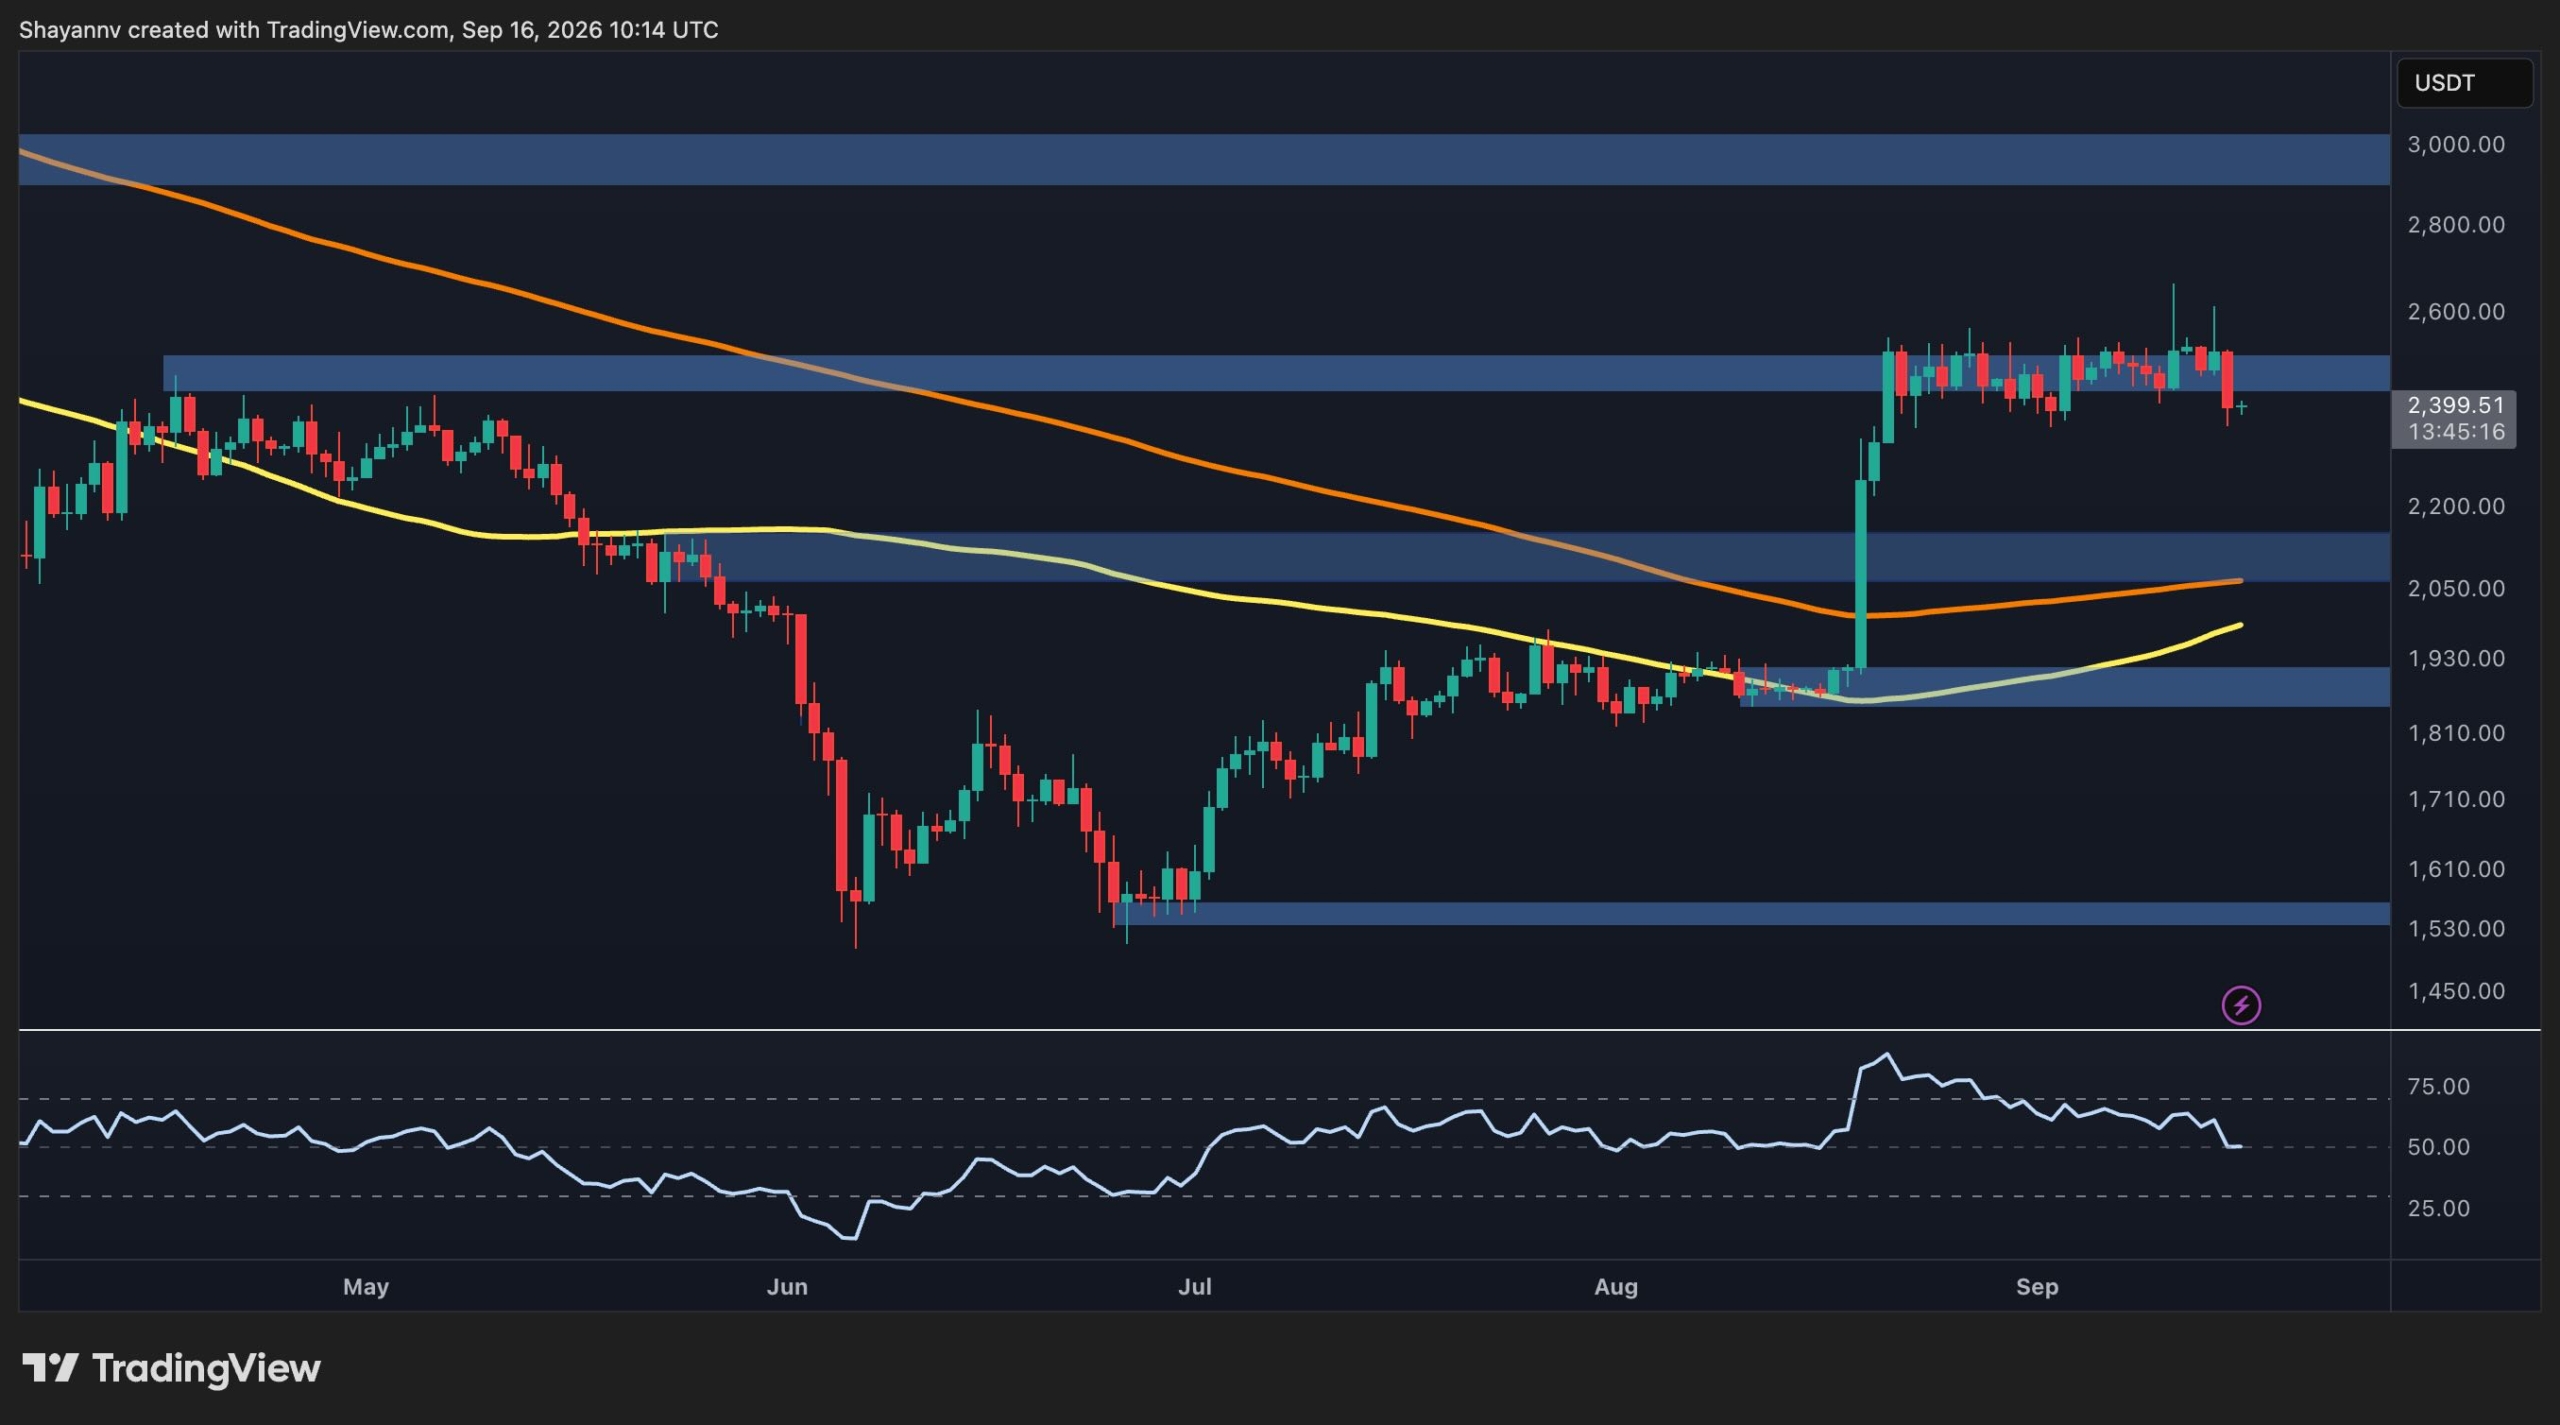
Ethereum is still trading around $2.4K after a sharp recovery from the $1.5K area. The latest charts show ETH consolidating beneath the $2.5K resistance region, while supply continues to tighten. The technical structure remains constructive on the higher timeframe, although short-term momentum has weakened. Ethereum Price Analysis: The Daily Chart The daily chart shows a […]

Ethereum and Base will pursue account abstraction designs, leaving smart wallets to manage different transaction formats across networks as development continues.
 Coinspeaker•Daniel Francis16 Sept
Deutsche Bank, founded in 1870, plans to start safeguarding bitcoin, ethereum, and selected stablecoins for institutional clients later in 2026. The 156-year-old German banking giant, which reported $2.217 trillion in assets under management (AUM) across its Private Bank and Asset Management businesses earlier this year, is preparing to manage wallets, private keys, and crypto transfers […]
Bitcoin.com News•Jamie Redman16 Sept
SparkLend's strategic focus on Ethereum could enhance its market position, potentially influencing DeFi lending dynamics and competition.
 CryptoBriefing•Editorial Team16 Sept
Hi! Structure: ETH is showing a bearish rejection from the 2,550–2,600 area after spending several weeks inside a broad 2,350–2,570 range. Bearish divergence: The chart marks a divergence around the recent highs, suggesting weakening upside momentum. Trend: Price is now below the 100 SMA (2,473), which shifts the short-term structure bearish unless ETH reclaims it. Momentum: RSI is around 36, showing bearish momentum but not yet deeply oversold. Key support: The highlighted 2,068–2,115 zone is the major downside support/target area shown on the chart. 2,350 is the nearer structural support. Overall: The chart favors a continued downside move while ETH remains below 2,470–2,500. A break below 2,350 would strengthen the case for a move toward 2,115–2,068. Conversely, reclaiming and holding above the 100 SMA would weaken the bearish setup.