
Ethereum crypto price tests $2,434 support as sellers return
Ethereum slipped to $2,431 before recovering, leaving traders waiting to see whether its closely watched support can survive the daily close.
 AMBCrypto•Adewale Olarinde15 Sept
Ethereum slipped to $2,431 before recovering, leaving traders waiting to see whether its closely watched support can survive the daily close.
AMBCrypto•Adewale Olarinde15 Sept
Ethereum is recovering and breaking out of the previous triangle, as discussed before, but this move is now much more powerful than initially expected. We have seen a sharp move over the last few days, with Ethereum gaining more than 30% and breaking well above the 2200 level, which looks impulsive. After the recent projected subwave “iv” pullback, we saw a strong jump into the projected subwave “v” of 3. However, the move currently looks more like a spike higher, so we should now watch for a new higher-degree wave 4 correction that could retest the 2400–2200 support zone before a continuation higher into wave 5. Alternatively, wave 5 could already be in place if we see a stronger and more impulsive decline.

I’m really waiting for this key trendline to break. In my opinion, once the breakdown happens, Ethereum could make a strong move to the downside. 🔴 ETH — SHORT BIAS ⚠️ Waiting for the confirmed breakout/breakdown 🥷🏻📉 Let’s see how it plays out.

Ethereum price fell toward $2,475 after a brief move above $2,600 failed, leaving ETH exposed to weaker momentum and leveraged volatility ahead of two major U.S. events. Ethereum price falls back below $2,500 According to data from crypto.news, Ethereum (ETH)…

Trade Details: Asset: ETH / USDT (4H Timeframe - Binance) Position Type: Long / Bullish Rebound Setup Entry Zone: Near the upcoming convergence of the channel line, 4H EMA 200, and the 38.2% Fibonacci retracement level. Take Profit (TP): First Target (Small Target): Middle of the channel. Main Target (Large Target): Top of the channel. Stop Loss (SL): Placed safely just below the 4H EMA 200. Risk/Reward Ratio: 3.49 Confluence Factors: Dynamic & Structural Support: Strong alignment between the 4H EMA 200, the 38.2% Fibonacci level, and the channel boundary acting as a major support zone. High Reward-to-Risk Profile: Offering an attractive risk-to-reward ratio of 3.49 with clear multi-tier profit targets. Target Structure: Structured scaling from the channel midpoint up to the channel resistance boundary. (Disclaimer: This analysis is for educational purposes only and does not constitute financial advice.)

Analysis Breakdown: Bitcoin ( BITSTAMP:BTCUSD - 4H / 6H): Following an impulse completion, price has entered an extended corrective consolidation. After multiple failed attempts to hold short entries near the highs, the broader bias leaned bearish as price rejected upper resistance. Current structure tracks an A-B-C corrective sequence: Failure to establish acceptance above the local range keeps downside targets active toward $75,500 (Wave C), with deeper continuation levels down to $74,400. Recent aggressive sell-offs have erased weekend gains, placing BTC right back into key mid-range decision territory. Ethereum ( BITSTAMP:ETHUSD - 2H / 4H): ETH recently tapped above range highs near $2,500+ before leaving pronounced upper rejection wicks—raising significant bull trap concerns. Price is currently testing ascending channel/wedge support. A sustained breakdown below this trendline opens up retests toward $2,416 and the lower support block. Only a clean reclaim and acceptance above local resistance invalidates the downside play. [ Solana ( COINBASE:SOLUSD - 2H): Consolidating within a narrowing triangle structure around the $100–$101 level. Holding base support keeps short-term scalp upside alive toward triangle resistance, but a breakdown follows broader market weakness. Macro Catalysts: High volatility expected mid-week with upcoming US Retail Sales and the pivotal FOMC Rate Decision / Fed Press Conference. Watch for false breakouts and liquidity sweeps before committing to directional swings.
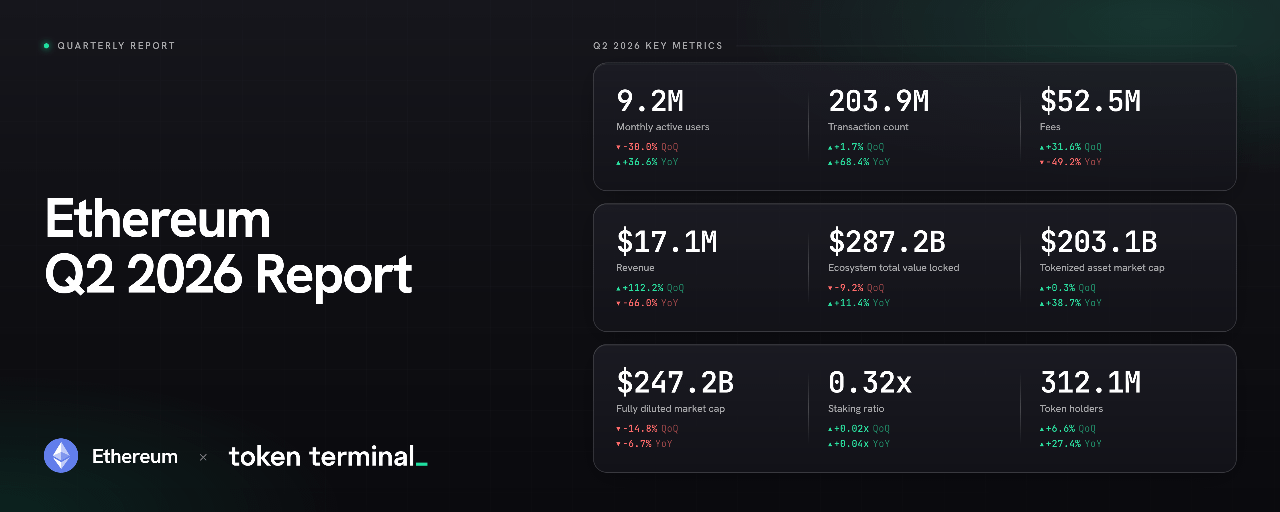
Ethereum network data shows record throughput, higher fees and ETH burn, even as monthly active users fell 30% in Q2 2026, widening adoption debate.
 Coinspeaker•Daniel Francis15 Sept
As Ethereum supply leaves exchanges, demand may not need to surge because fewer available coins can magnify smaller buying waves.

📊 ETH/USD 2H — Professional Technical Analysis 🟢 Current Price: $2,480.87 | Coinbase | 2H Market structure: Neutral-to-bearish in the short term, with price currently testing an important demand/liquidity area. 🧭 1. Overall Market Structure ETH has transitioned from the previous bearish descending channel/trendline into a broader sideways consolidation. The bearish trendline was broken around Sept. 4, giving buyers temporary control. 📈 Price subsequently established a range roughly between $2,420–$2,550. A strong upside liquidity sweep pushed ETH toward $2,660, but that move was aggressively rejected. ⚠️ Since that rejection, price has been making a short-term sequence of lower highs, indicating weakening bullish momentum. Current bias: 🟠 Neutral → Bearish The key question now is whether the $2,420–$2,460 demand zone holds. 🟩 2. Demand Zone $2,420 – $2,460 This is the most important area immediately below current price. Price has repeatedly reacted around this region, making it a significant decision zone. Bullish reaction: If ETH holds this zone and produces a strong 2H bullish rejection: $2,480 → $2,520 → $2,550 → $2,610 → $2,667 🚀 A reclaim of $2,550 would significantly improve the bullish structure. Bearish reaction: If ETH loses $2,420 with a convincing 2H close: $2,400 → $2,355 This would confirm that the demand zone has failed. 💧 3. Liquidity Zone The chart identifies liquidity around: $2,405 – $2,430 This is particularly important because price could first dip into this area to collect sell-side liquidity before deciding on direction. A wick below $2,420 followed by a rapid reclaim would be a potentially bullish liquidity sweep. 🧲📈 Conversely, sustained trading below the zone would favor continuation lower. 🔴 4. Major Resistance $2,667.59 — Major Resistance This is the dominant resistance marked on the chart. ETH previously made a sharp move toward this area and was rejected. Therefore: $2,550 → $2,610 → $2,667 are the major upside obstacles. A clean 2H breakout and acceptance above $2,667 would invalidate the current bearish scenario and potentially signal a new bullish expansion. 🚀 Above $2,667 = bullish breakout territory 🟢 5. Major Support $2,355.67 — Major Support This is the major structural support shown on the chart. If the $2,420–$2,460 demand zone fails, this becomes the next major downside objective. 📉 Potential bearish path: $2,480 ↓ $2,430 ↓ $2,400 ↓ $2,355 🎯 6. Key Scenarios 🐂 BULLISH SCENARIO Condition: ETH holds $2,420–$2,460 and reclaims $2,500–$2,520. Targets: 🎯 $2,520 🎯 $2,550 🎯 $2,610 🎯 $2,667 The strongest confirmation would be a 2H close above $2,550, followed by successful retest. 🐻 BEARISH SCENARIO Condition: ETH fails to hold $2,420 and closes decisively below the demand zone. Targets: 🎯 $2,400 🎯 $2,355 Potentially lower if $2,355 breaks. The chart's projected bearish move toward support therefore makes technical sense as a scenario, but it is not confirmed until the demand zone breaks. ⚠️ 7. What I Would Watch Now Level Importance Interpretation $2,667 🔴 Extreme Major resistance $2,610 🔴 High Upside rejection/breakout level $2,550 🟠 High Short-term bullish confirmation $2,500 🟡 Medium Psychological/structure level $2,460 🟢 High Demand-zone upper boundary $2,420 🔴 Very High Demand-zone breakdown trigger $2,400 🔴 High Liquidity/support $2,355 🟢 Major Structural support 🧠 Professional Verdict ETH/USD 2H: 🟠 NEUTRAL-BEARISH ETH is currently sitting above an important demand/liquidity area, so chasing shorts directly at ~$2,480 carries less favorable positioning than waiting for confirmation. The cleanest read is: 🟢 Hold $2,420–$2,460 → bullish reaction possible toward $2,550+ 🔴 Break $2,420 → bearish continuation toward $2,400/$2,355 🚀 Break & hold $2,667 → major bullish structure shift The $2,420–$2,460 zone is the battlefield. Until ETH either decisively rejects from it or breaks beneath it, the chart remains in a consolidation/decision phase rather than a confirmed directional trend. TradingView-style idea: 📌 “Wait for confirmation at liquidity; don't predict the move—trade the reaction.” Educational technical analysis only, not financial advice.

 CoinDesk•Omkar Godbole15 Sept
Keeper's rebranding and multichain support could streamline crypto management, fostering broader adoption and integration in a decentralized economy.
 CryptoBriefing•Vivian Nguyen15 Sept
Could DFDV’s SOL accumulation signal the start of a broader DAT buying trend?
AMBCrypto•Ritika Gupta15 Sept
Ethereum's ETF inflow surge highlights shifting investor preferences, potentially altering the crypto market's traditional dynamics and allocations.
CryptoBriefing•Editorial Team15 Sept
Shiba Inu’s behind-the-Scenes upgrade further along than it looks.
 U.Today•Tomiwabold Olajide15 Sept
Ethereum trades near $2,474 as the Clarity Act vote looms. Key levels, targets, and scenarios for ETH's path toward $3,000 this week.
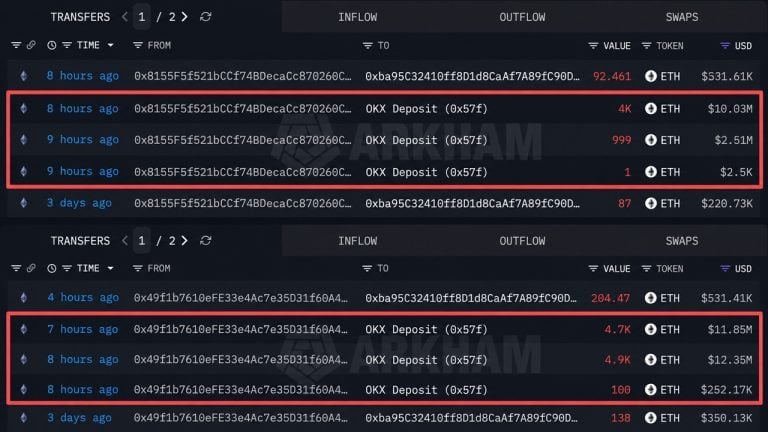
Two wallets that had been quiet for more than a year moved 14,700 ETH, worth about $36.94 million, into OKX on Sept. 14, and onchain records show those coins landed in 2021 when they were worth nearly $57 million. The Transfers, Timestamped Analysis firm Lookonchain first flagged the deposits and said the two addresses possibly […]
 Bitcoin.com News•Shiraz Jagati15 Sept
Mutsamudu, Comoros, September 15, 2026 – MEXC, a pioneer in 0-fee digital asset trading, has released its September 2026 Proof of Reserves (PoR) report, audited by Hacken, confirming that user assets remain fully backed across all major reserve assets. The BTC reserve ratio increased to 297%, up from 288% in August. MEXC continues to disclose reserve data on a monthly basis, aiming to enhance transparency and safeguard the security of user funds. According to the audited report, dated as of the September 10, 2026 snapshot, reserve ratios for all disclosed assets are as follows: BTC: 297%. Reserves of 12,202.13 BTC cover 4,106.57 BTC in user holdings. USDT: 119%. Reserves of 1,818,202,910.24 USDT cover 1,526,526,878.38 USDT in user holdings. USDC: 111%. Reserves of 299,925,929.77 USDC cover 269,894,125.25 USDC in user holdings. ETH: 111%. Reserves of 58,917.60 ETH cover 53,243.98 ETH in user holdings. MEXC verifies its reserves through Merkle Tree technology, allowing individual users to confirm their balances are included in the total reserve calculation without exposing other users’ data. For this month’s audit, Hacken conducted a comprehensive evaluation of MEXC’s reserves, covering Proof of Liabilities, Proof of Ownership, Reserves Calculation, and a PoR Assessment. Hacken confirmed that MEXC’s reserves exceed a 1:1 ratio across all in-scope assets, fully covering user liabilities. “Protecting user assets and earning their trust are fundamental responsibilities, not optional commitments,” said Vugar Usi, CEO of MEXC. “In an industry where confidence has been tested time and again, transparency must be demonstrated through actions that users can independently verify. That is why we publish verifiable Proof of Reserves every month, giving users the ability to validate their asset data at any time rather than simply relying on our assurances. Our commitment is to continue raising the standard for transparency, accountability, and asset protection, and to build the kind of trust that is earned consistently over time.” To further protect user assets, MEXC maintains the Futures Insurance Fund, which absorbs losses from liquidations triggered by extreme market conditions. The fund held a balance of approximately 798 million USDT as of press time. MEXC also operates The Guardian Fund, a dual-reserve structure combining USDT and BTC holdings that offers full compensation coverage for platform-related issues. It held a balance of $101 million as of press time and plans to expand to $500 million within two years. To view the latest Proof of Reserves snapshot and audit report, please visit the MEXC Proof of Reserves page. About MEXC Founded in 2018, MEXC is a leading global multi-asset trading platform built as your 0-fee gateway to infinite opportunities. Serving users across 170+ markets, MEXC provides simple and efficient access to crypto, stocks, tokenized assets, derivatives, and a growing range of TradFi-linked opportunities through one account and one gateway. With 0 trading fees, deep liquidity, broad asset coverage, and a high-performance trading experience, MEXC is designed for retail users who want to discover earlier, act faster, and trade with fewer barriers. As crypto and traditional finance continue to converge, MEXC is committed to making global opportunities more accessible, helping users trade freely and MEXCmize every opportunity. MEXC Official Website| X | Telegram |How to Sign Up on MEXC For media inquiries, please contact MEXC PR team: media@mexc.com Risk Disclaimer: This content does not constitute investment advice. Given the volatility of financial markets, including digital assets, tokenized assets, and traditional financial products, investors should carefully assess market conditions, underlying asset fundamentals, and potential financial risks before making any investment or trading decisions. Source
 NewsBTC•BlockmanPR15 Sept
Ethereum and Base are pursuing different account abstraction designs after talks failed, according to Ethlabs researcher Derek Chiang.
 Cointelegraph•Cointelegraph by Zoltan Vardai15 Sept
CRYPTOCAP:ETH AT THE FINAL DECISION POINT! BREAKOUT TO $3K OR BREAKDOWN TO $1.8K? CRYPTOCAP:ETH is approaching a critical confluence of Descending Trendline resistance, horizontal supply, and structural resistance Near $2,550–$2,660. The current price action is testing the upper boundary of the prevailing market structure. A decisive breakout above $2,660, followed by a daily close and successful retest, would confirm bullish structural expansion. Key Levels: 🔹 Resistance: $2,550–$2,660 🔹 Fibonacci 0.382: $2,143 🔹 Fibonacci 0.5: $2,000 🔹 Fibonacci 0.618: $1,870 🔹 Major Support: $1,500 Technical Scenarios: → Bullish: Breakout + Retest above $2,660 could initiate a continuation toward higher liquidity zones. → Bearish: Rejection from supply followed by a break of the ascending trendline may trigger a corrective retracement toward $2,143, $2,000, and $1,870. Invalidation: Sustained acceptance above the marked bearish invalidation level near $2,670. The next directional move depends on liquidity displacement, market structure confirmation, and acceptance beyond the decision zone. NFA & DYOR

Tonkeeper has rebranded as Keeper, with the wallet now supporting seven blockchain networks, including Bitcoin and Ethereum.
 The Block•Brian Danga15 Sept