Trump calls for slashing interest rates to '1% or less' after the Fed's first hike in 3 years
The Federal Reserve hiked rates Wednesday for the first time in 3 years. President Trump said the FOMC should cut.
- neutral toward Donald Trump · 97%
The Federal Reserve hiked rates Wednesday for the first time in 3 years. President Trump said the FOMC should cut.

AMEX:SPY faded hard after the Fed Warsh speech. Today's move was significant — price dropped from 761.67 all the way to 749.60, a 12-point range. This was the session everything had been building toward. For the last six trading days, AMEX:SPY kept putting up above-average volume with tight ranges — heavy participation, almost no price movement. That's a coiled market, and today it uncoiled. The range came in at nearly triple a normal day, and the volume was the heaviest of this entire leg. 756.70 is the big one. That level held four separate times over the past two weeks — every time sellers pushed into it, they got nothing back. Today it broke, and it broke with the range expansion and volume that had been missing on every previous attempt. That's what makes this break different from the ones that failed. The bearish structure was already in place before today. AMEX:SPY lost the 5-12 @ripster47 EMA cloud on September 8, then broke the 34-50 cloud on September 15. Today delivered the move those signals were pointing at. Price found buyers at 750 and closed back at 754.05, about 4.5 points off the low. That's a real recovery, and it happened at an important level — but the close still finished in the lower third of the day's range, so confirmation would come from tomorrow closing green on strong volume before calling that low the bottom. Levels 749.60 and 750.00 are the floor. Hold them and this becomes a bounce attempt. Lose them and 739.63 is next, then 731.96. Above, 756.70 and 760.57 are resistance now — they've flipped. AMEX:SPY

President Trump offered a fiery response to the Federal Reserve’s decision to hike interest rates on Wednesday, demanding instead that rates be drastically lowered quickly. “Interest Rates in the United States should be 1%, or less, because we are the Best Credit in the World — BY FAR. Our Country is BOOMING with new Investment!”…
 The Hill•Julia Manchester16 Sept
President Donald Trump demanded the Federal Reserve slash interest rates to 1% "or less," hours after the central bank announced its first rate hike since 2023.
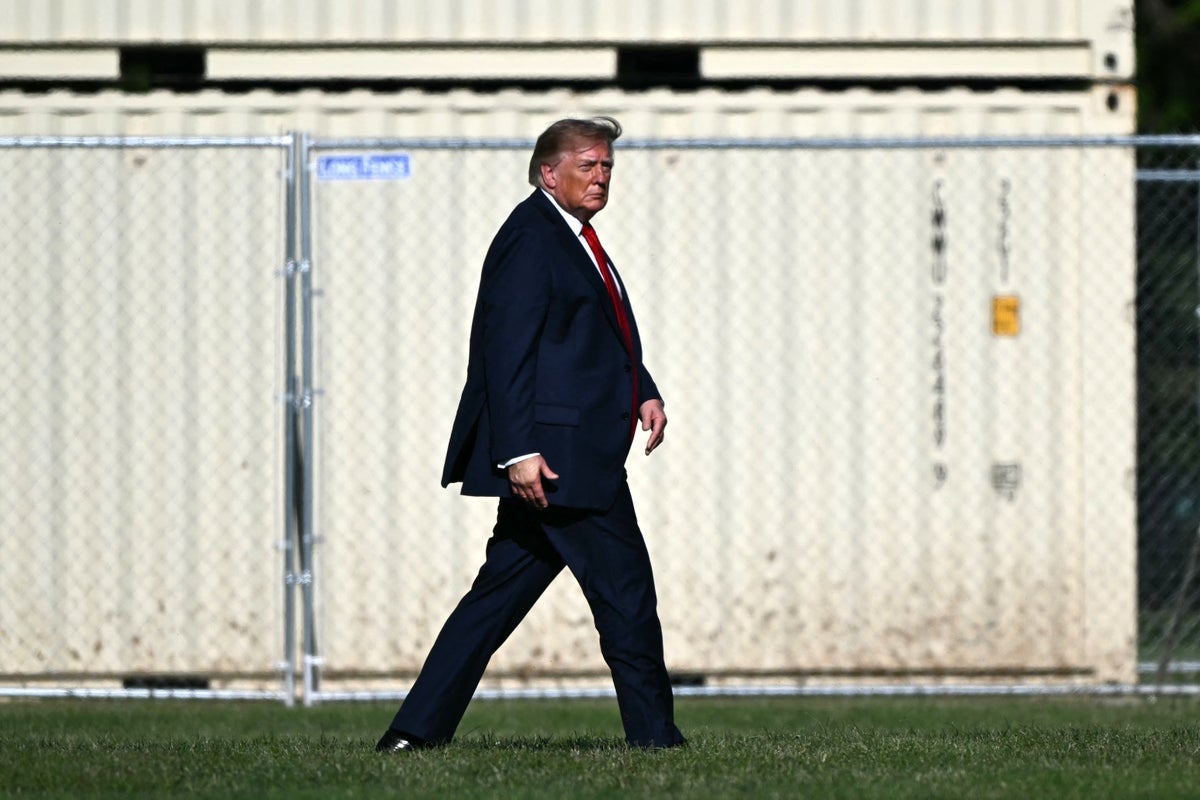
President Donald Trump on Wednesday slammed the Federal Reserve after the central bank raised its benchmark rate for the first time in more than three years with a nonsensical rant in which he lectured the bank on how to run monetary policy, insisting interest rates "should be 1%, or less," hours
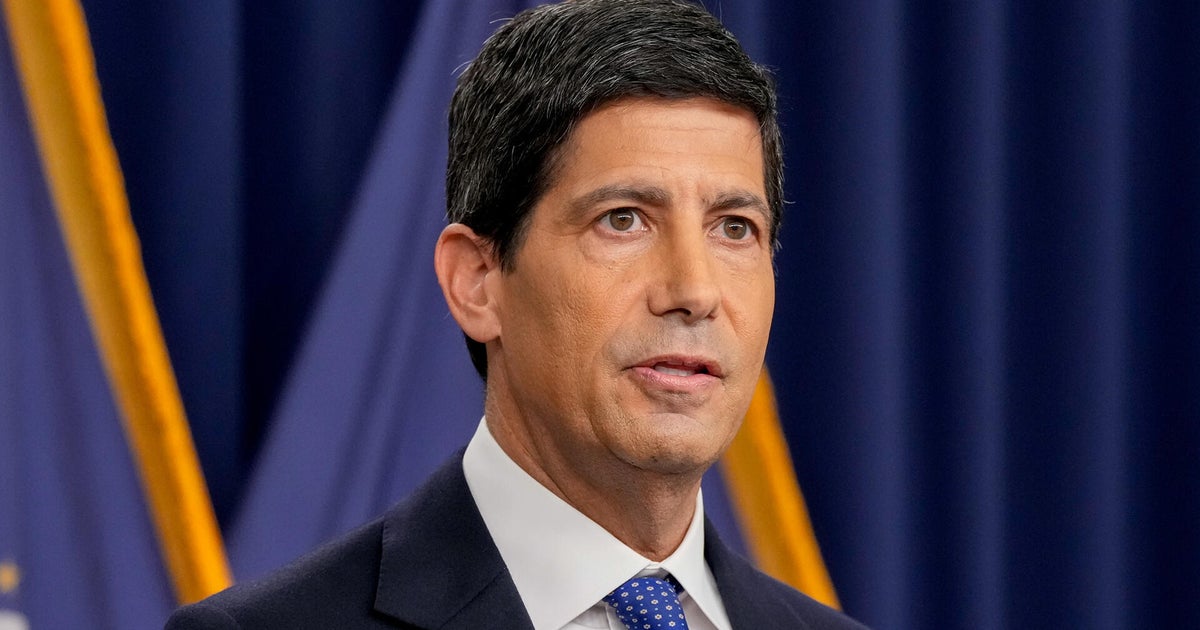
Federal Reserve unanimously votes to raise interest rates; President Trump stumping for GOP Senate nominee Michael Whatley in North Carolina.

Central bank signals willingness for further action as chair Kevin Warsh warns that ‘inflation is too high and has been for too long’

The Federal Reserve unanimously raised interest rates by a quarter point despite repeated calls from President Donald Trump for lower rates.

Bitcoin price traded near $76,200 after a volatile week as the failed CLARITY Act vote and the Federal Reserve’s rate increase kept pressure on the market. Technical indicators now point to resistance near $78,600, while liquidation data places the main…

Gold ( OANDA:XAUUSD ) started to decline with strong bearish momentum following the Federal Funds Rate decision and remarks from Kevin Warsh. The price is now trading inside the Heavy Support Zone, near the Support Lines and the major Potential Reversal Zone(PRZ) . Can gold hold this support structure and trigger a bullish recovery? Macro Outlook The recent sell-off accelerated after the Federal Funds Rate decision and Warsh’s remarks increased pressure on gold. However, gold has now reached an important technical area where buyers could attempt to regain short-term control. Technical Analysis From an Elliott Wave perspective, gold appears to have developed a corrective structure to the downside over the past 13 days, suggesting that at least a short-term bullish move could begin from the current area. From a classical technical analysis perspective, gold also appears to have formed a Descending Broadening Wedge Pattern, which could support a potential bullish reversal. A Positive Regular Divergence(RD+) is also visible between two Major Consecutive Valley Pivots, providing another sign that bearish momentum may be weakening. 💡 Educational Note: A Descending Broadening Wedge can signal weakening bearish control when price begins reacting strongly from its lower boundary, especially when supported by bullish divergence. I expect gold to start moving higher from the Potential Reversal Zone(PRZ) and the Support Lines, with an initial target around $4,317. If bullish momentum increases and gold breaks above the Resistance Lines, the recovery could extend toward $4,391. Trade Setup First Take Profit(TP): $4,317 Second Take Profit(TP): $4,391 Stop Loss(SL): $4,170 Key Trading Levels: $4,330 _ $4,400 Which level do you think gold will reach first? 🟢 $4,391 🔴 $4,170 📌 Gold Analysis(XAUUSD), 4-hour time frame. 🛑 Always use proper risk management and set a Stop Loss(SL) for every position. 🚀 If this analysis helps your trading plan, a BOOST would help more traders discover it.

Housing professionals said the psychological effect on homebuyers and sellers is immediate
 HousingWire•Jonathan Delozier16 Sept
War-fueled inflation remains too high, the U.S. central bank said, requiring the first hike in three years.
 Foreign Policy•Keith Johnson16 Sept
But watch out for the pitfalls.
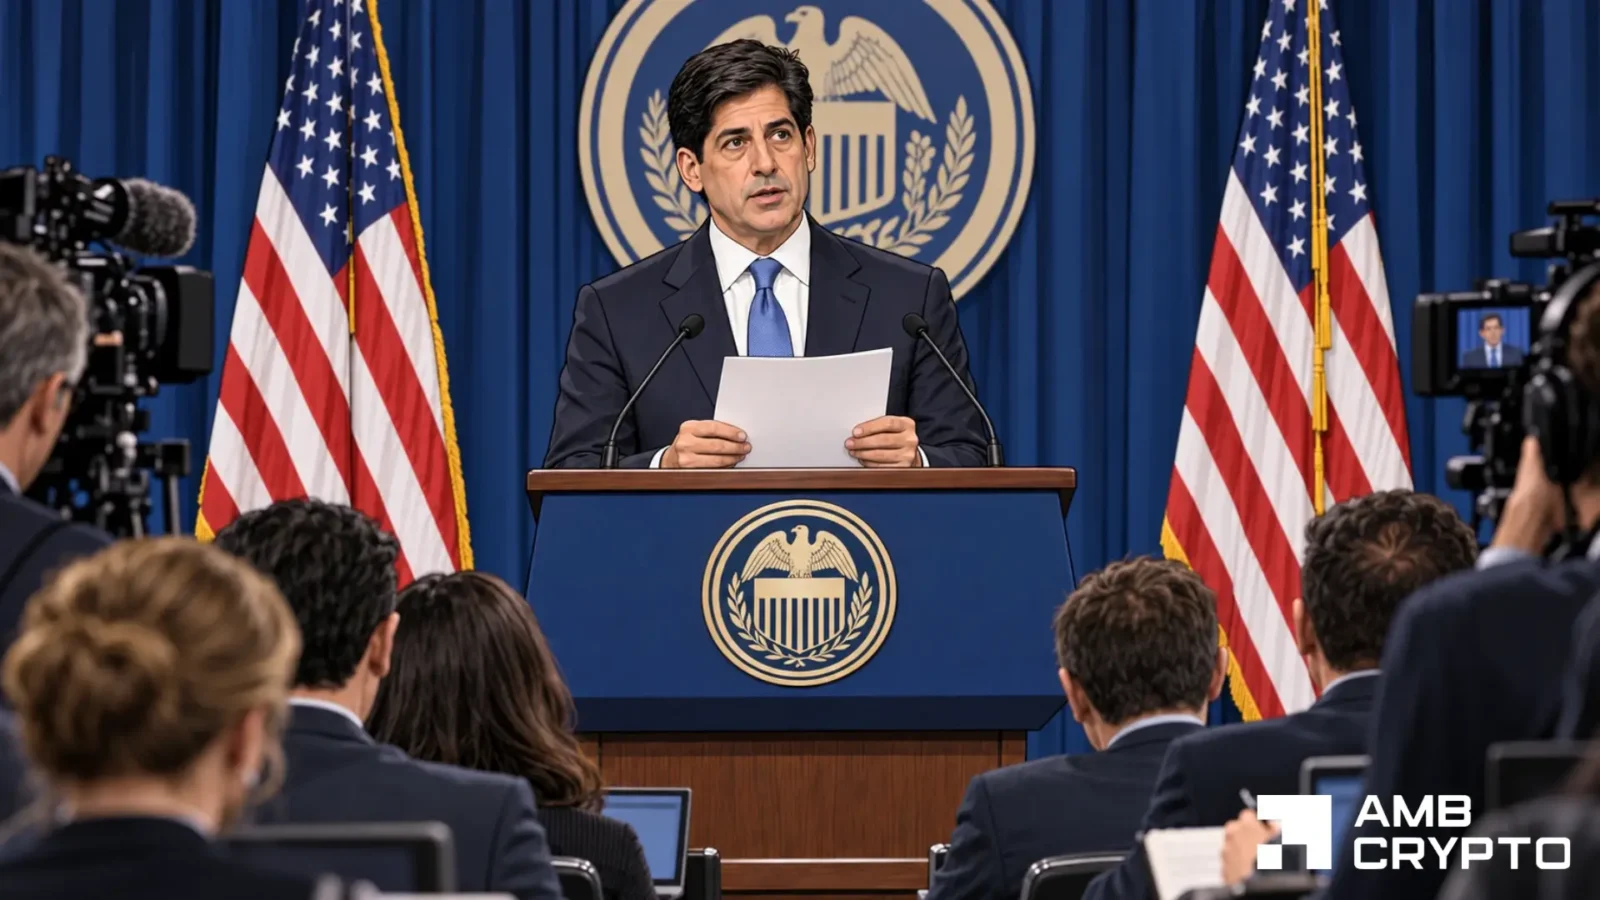
Bitcoin held steady after the Fed’s rate increase, but projections for another hike and no cuts in 2027 could pressure crypto.
 AMBCrypto•Adewale Olarinde16 Sept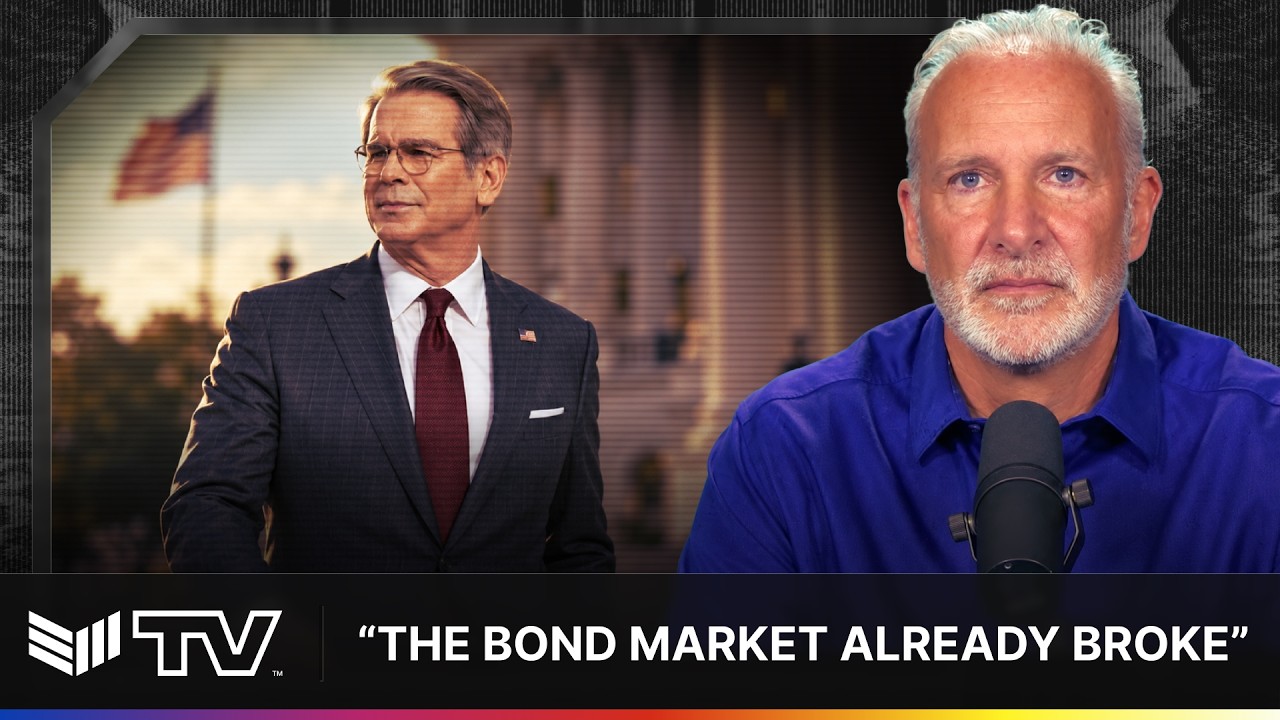
Bitcoin Magazine Peter Schiff: “The Fed Has Already Lost The Battle Against Inflation” & BTC vs GOLD Debate Peter Schiff says the bond market didn't break recently, it broke in 2020, and everything since has been a slow unwind. This post Peter Schiff: “The Fed Has Already Lost The Battle Against Inflation” & BTC vs GOLD Debate first appeared on Bitcoin Magazine and is written by Patrick Green .

Two of Wall Street’s most influential voices issued warnings this week that markets have largely ignored. Jamie Dimon and Mark Zandi rarely align, but both flag structural risks ahead. JPMorgan CEO Jamie Dimon is warning about a huge transfer of small-business ownership. Moody’s Analytics chief economist Mark Zandi says the Fed could damage an economy
 BeInCrypto•Luis Blanco16 Sept
Bitcoin ( BINANCE:BTCUSDT ) experienced sharp volatility after the Federal Funds Rate was released at 4.00%, in line with expectations, followed by remarks from Kevin Warsh. Unlike gold and U.S. stock indices—particularly the S&P 500—Bitcoin has so far managed to hold inside its Support Zone and avoid a similarly sharp decline. Can BTC defend $75,000 and turn this relative strength into another move toward $80,000? Macro Outlook Nearly $1 billion in long positions could be liquidated around $74,860, making this an important downside liquidity area to monitor. Bitcoin could also remain sensitive to developments in the Middle East, movements in the S&P 500, and gold price action. Technical Analysis Bitcoin is currently trading inside the Support Zone and near Cumulative Long Liquidation Leverage($74,680-$73,800). A valid Golden Cross has also formed between the 50_SMA(Daily) and 200_SMA(Daily), which could support the broader bullish structure. 💡 Educational Note: A Golden Cross forms when a shorter-term moving average crosses above a longer-term moving average and is generally considered a bullish trend signal, although price confirmation remains important. From an Elliott Wave perspective, Bitcoin’s structure over the past 12 days appears more corrective than impulsively bearish, suggesting that another bullish move could develop. I expect Bitcoin to move higher over the coming hours. If BTC breaks above the key trading level of $77,280, further upside could develop toward $78,370 and eventually the Cumulative Short Liquidation Leverage. As long as Bitcoin remains above $73,500, the bullish scenario remains valid. Trade Setup First Take Profit(TP): $76,990 Second Take Profit(TP): $78,370 Third Take Profit(TP): Cumulative Short Liquidation Leverage($80,700-$79,800) Stop Loss(SL): $73,500(Worst) Key Trading Level: $77,280 New CME Gap: $79,270-$79,110 Do you think Bitcoin can hold above $75,000? 🟢 Yes 🔴 No 📌 Bitcoin Analysis(BTCUSDT), 1-hour time frame. 🛑 Always use proper risk management and set a Stop Loss(SL) for every position. 🚀 If this analysis helps your trading plan, a BOOST would help more traders discover it.

Bitcoin and ether whipsawed as the Federal Reserve delivered its first rate hike in more than three years.
 The Block•Kyle Baird16 Sept
 The New York Times•Colby Smith16 Sept
The Fed hiked rates by a quarter point at the September meeting. Inflation is a top priority, Warsh said.