
England crush Sri Lanka to seal T20 series win
England comfortably chase a below-par target of 146 to thrash Sri Lanka by six wickets and seal the three-match T20 series with a game to spare.
 BBC17 Sept
England comfortably chase a below-par target of 146 to thrash Sri Lanka by six wickets and seal the three-match T20 series with a game to spare.
BBC17 Sept
Latest score from the second T20 international between England and Sri Lanka at Sophia Gardens in Cardiff. Watch live on Sky Sports Cricket.
 Sky Sports17 SeptSky Sports17 Sept
Over-by-over updates from Cardiff, 6.30pm BST start The Spin: AI is reshaping cricket | And email Daniel Brook is 288 not out, in terms of the last time he was dismissed in this format. He’s an absolute joke, good enough to go down as one of the best we’ve ever seen if he keeps focused and working hard. Er, it’s raining. Hopefully not for long, but it’s coming down more heavily than is optimal. Continue reading...
 The Guardian•Daniel Harris17 Sept
Country: Sri Lanka Source: Government of Sri Lanka Please refer to the attached Infographic.
 ReliefWeb•Government of Sri Lanka17 Sept
Countries: World, Argentina, Armenia, Australia, Chile, Cuba, Democratic Republic of the Congo, Djibouti, Dominican Republic, Eritrea, Ethiopia, France, Haiti, Indonesia, Iran (Islamic Republic of), Jamaica, Jordan, Malaysia, Nigeria, Pakistan, Philippines, Somalia, South Africa, Sri Lanka, Syrian Arab Republic, Thailand, Türkiye, United States of America, Viet Nam Source: World Meteorological Organization Please refer to the attached file. WMO: Recent water trends have serious future implications The WMO State of Global Water Resources report is a comprehensive science-based annual assessment of the hydrological cycle and extreme events in 2025 and over the past five years. 2025 was one of driest years for river discharge in 35 years Past 7 years have seen abnormal river flows Water storage on Earth’s land surface has decreased in past 10 years Widespread glacier loss across all regions for 4th consecutive year Asia and Africa are the regions most affected by water-related disasters Water data availability has improved, but gaps remain in hard hit areas Geneva, Switzerland, 17 September 2026 (WMO) – Rivers across the globe in 2025 had one of the driest years in more than three decades, according to a new report from the World Meteorological Organization (WMO). It shows a continuation of the long-term decline in Earth’s freshwater storage and in glacier retreat - trends with serious implications for people and economies in the future. The WMO State of Global Water Resources Report shows that the water cycle has become more erratic and unpredictable, swinging between too little or too much. The past seven years have seen the fewest rivers with “normal” flows since 1991. Asia and Africa together accounted for at least half of all recorded water-related extreme events and more than 80% of reported associated deaths over the past five years, it says. The report provides a comprehensive, science-based assessment of the entire water cycle loop, including river discharge, groundwater, evapotranspiration, land water storage, and snow and ice, as well as high-impact events. It covers the year 2025 and summarizes findings of the past five years since it was first published. Some parts of this cycle are fast – such as precipitation, river flow, soil moisture – they respond to weather within days or weeks. Others, like groundwater, glaciers and seasonal snowpack, are slow, they accumulate or deplete over seasons to decades or longer. Traditionally these slow reserves have acted as the planet's savings account: a buffer that absorbs bad years so that a single drought or a single dry season does not translate directly into a water crisis,” said WMO Secretary-General Celeste Saulo. “We are depleting that savings account. Global terrestrial water storage has shown a declining trend since 2014–2016 - a persistent, decade-long signal. For the fourth consecutive year, every major glaciated region on Earth lost ice mass. Groundwater tells a similar story: nearly two-thirds of monitored wells worldwide showed conditions outside the historical norm in 2025, and the balance shifted further toward deficit compared with 2024, not toward recovery,” said Celeste Saulo. “At the same time, we are seeing more water-related disasters. The strengthening El Niño will increase the risk of drought in some areas, and flooding in others,” she said. The report highlights some major areas of concern: 2025 was one of driest years for river discharge globally in 35 years, with below-normal flows over 36% of global basin area. This is based on data from simulations from 13 global hydrological models, driven by observed weather data. For the seventh year in a row, the number of river basins with “normal” conditions was in a clear minority: ranging between 34-38%, compared to the average of 46% between 1991-2020, according to the report. Terrestrial water storage – the total amount of water stored in groundwater, lakes and rivers, soil moisture, vegetation and ice and snow – has been in decline since mid-2010s. 2025 marked the fourth consecutive year with widespread glacier loss across all regions – leading to short term hazards like floods and long-term water insecurity. Between 2023-2025 glaciers lost mass in each reporting year with cumulative global glacier mass loss at 1400 Gigatonnes of water. This is roughly equal to the water required to fill about 560 million Olympic-sized swimming pools, or about one third of annual freshwater withdrawals. In each of the past five years, National Meteorological and Hydrological Services around the globe reported record-breaking floods and droughts. Some places have had no recovery time between one event and the next. “Water respects no borders. A river basin's water balance depends on what happens in another country. A glacier's retreat in one country reshapes water availability for populations hundreds of kilometers downstream. This is precisely why we need shared data, shared standards, and shared early warning — the exact function WMO exists to perform,” said Celeste Saulo. Dozens of experts from National Meteorological and Hydrological Services, data centres, researchers and partner institutions shared in situ observations, model outputs and space-based data and contributed to the report, which has expanded from three to 15 hydrological variables since the first edition in 2021. Country coverage has greatly expanded. However, Africa and Asia are still among the least represented regions in terms of hydrological observations in the report, even though they are most affected by extremes. 2025 was one of the warmest years on record. A weak La Niña emerged towards the end of the year after neutral conditions, and there was a predominantly negative Indian Ocean Dipole, which influenced precipitation. River basins Across the five reporting years (2021-2025), recurring below-normal river discharge was observed in major parts of the Amazon and La Plata basins, North America, Central and East Africa, Central Asia and the Middle East. Annual river discharge in 2025 was above-normal to much-above-normal across South and South-East Asia and parts of northern South America. In Africa, there were above-normal flows in the Senegal, Niger, Lake Chad, Orange and Limpopo basins, but much-below-normal discharge in the Nile, Congo and Zambezi basins. Below-normal to much-below-normal river discharge affected several major regions, including much of North America, the La Plata and São Francisco basins of South America, Eastern European basins, the Middle East and Central Asia. Reservoir and lake levels followed similar geographical trends as for river basins. African lakes were largely much above normal, with Kariba a notable exception. Terrestrial water storage Terrestrial water storage shows a persistent negative trend since 2014-2016 with increasing area under below-normal conditions. Between 2021-2025 below-normal terrestrial water storage repeatedly affected the south-western United States, Patagonia and the subtropical Andes, the Ganges–Indus headwaters, North Africa, the Middle East, Central Asia and eastern China, while persistent positive anomalies occurred in parts of sub-Saharan Africa, the Sahel and the Tibetan Plateau. In 2025, it was below-normal in northern and southwestern North America, Patagonia, Eastern Europe, the Middle East, Central Asia, eastern Brazil, northern India, parts of Northern Europe, the Russian Federation, China and Northern Africa. La Plata in South America showed signs of partial recovery from the long-term drought. Much-above-normal storage continued from 2024 into 2025 in Central and Southern Africa. Groundwater levels Persistent groundwater deficits were observed during 2022–2025 in parts of the Americas, Europe, the Middle East, India, southern Africa and Australia. Persistent and widespread below-normal to much-below-normal groundwater levels were observed across Central and Eastern Europe, central United States, parts of Mexico, northern and central Chile, northeastern and central-western Brazil, northern South Africa, northwestern India and parts of southern Australia, pointing to a cumulative depletion with multi-year drying trend. There were above-normal to much-above-normal conditions include parts of France, much of Northern Europe, the southeastern United States, large parts of South Africa, South-East Asia, and eastern Australia. Snow cover and glaciers Snow conditions were below normal across Europe in 2025, whilst the Russian Federation and North America showed strong regional contrasts. In the hydrological year 2025, glaciers lost 408 (±132) Gigatonnes of mass, equivalent to 1.1 (±0.4) mm of sea-level rise. It marked the fourth consecutive year in which every major glaciated region recorded a net loss. Central Asia, South Asia West, Russian Arctic, Iceland, Western Canada and USA all recorded annual mass balances that ranked among the three most negative years on record for that region. Some regions dominated by smaller glaciers, such as the Caucasus, Western Canada and the USA, and Central Europe may already have reached “peak water conditions,” the threshold where the glacier reaches its maximum runoff due to melting. Extreme events From 2021-2025, South America’s La Plata and Amazon basins, the Middle East and the Greater Horn of Africa experienced persistent multi-year drought conditions, while severe floods repeatedly affected West and Central Africa and South-East Asia. Asia and Africa were the regions most affected by extreme hydrometeorological events in 2025, with several African countries experiencing major flooding for two (Nigeria) or three consecutive years (Democratic Republic of the Congo). South and South-East Asia was hit by compound tropical cyclones and intense monsoon, leading to up to 3 600 deaths across affected countries - Sri Lanka, Pakistan, Viet Nam, Indonesia, Thailand, Malaysia, the Philippines. Assessing the economic losses associated with water-related disasters remains challenging in many countries. Jamaica reported that hurricane Melissa resulted in losses equivalent to 41% of GDP. Cyclone Ditwah cost Sri Lanka around 4% of GDP. Severe drought gripped East Europe, the Mediterranean, and Middle East and also returned to the Greater Horn of Africa after one of the driest October–December seasons on record linked to La Niña and a negative Indian Ocean Dipole. Notes to Editors The WMO State of Global Water Resources 2025 report includes scientific contributions from dozens of WMO Members, partners and scientists. Full details of the datasets, references and institutions involved are available in the report. The WMO Secretariat wishes to thank everyone who dedicated their time and expertise to this report. The World Meteorological Organization is the United Nations System’s authoritative voice on Weather, Climate and Water. For further information, please contact: Clare Nullis, WMO media officer, cnullis@wmo.int, +41 79 709 13 97 Global Communication and Engagement Media Contact media@wmo.int
ReliefWeb•World Meteorological Organization17 Sept
Countries: Myanmar, Bangladesh, India, Indonesia, Malaysia, Sri Lanka, Thailand Source: UN High Commissioner for Refugees Please refer to the attached Infographic. The humanitarian crisis in Myanmar remains one of the world’s most complex and protracted, marked by repeated waves of displacement and limited prospects for durable solutions. Escalating conflict and human rights violations have forced millions to flee within Myanmar and across borders. As of August 2026, 4 million people are internally displaced, and 1.63 million are refugees and asylum-seekers. The crisis has been worsened by disasters and extreme weather in recent years, including Cyclone Mocha (May 2023), Typhoon Yagi (September 2024), and a 7.7 magnitude earthquake (March 2025). With no sign of improvement, prospects for safe and voluntary returns, especially for 1.33 million Rohingya remain bleak. As humanitarian resources in host countries grow increasingly strained, thousands of Myanmar refugees are undertaking dangerous journeys in search of protection, safety, family reunification, and livelihoods. UNHCR is adopting a Route-Based Approach to improve early access to protection and solutions for refugees and asylum-seekers - ultimately reducing the need for risky onward movement. UNHCR continues to urge States across the region to strengthen coordination to save lives at sea, fully deploy rescue capacities, and ensure safe, timely disembarkation—upholding the principles of humanity, solidarity, and shared responsibility.
ReliefWeb•UN High Commissioner for Refugees16 Sept
Country: Sri Lanka Source: Government of Sri Lanka Please refer to the attached Infographic.
ReliefWeb•Government of Sri Lanka16 Sept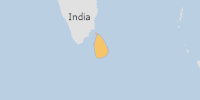
On 14/09/2026, a flood started in Sri Lanka, lasting until 16/09/2026 (last update). The flood caused 0 deaths and 25 displaced .

Harry Brook and Jos Buttler went berserk in a T20 at Southampton for the second time this summer as England smoked 254-4 against Sri Lanka during a 119-run victory in the series opener - their first game since Kevin Pietersen's appointment as white-ball mentor.
Sky Sports15 Sept
Tom Banton notched an inspired 52no off 24 balls to steer England to a comprehensive six-wicket victory over Sri Lanka in the second T20 to clinch the three-match series with a game to spare.
Sky Sports15 Sept
Harry Brook hits a brutal century and draws comparisons with Kevin Pietersen as England thrash Sri Lanka by 119 runs in the first T20 in Southampton.
BBC15 SeptHarry Brook hits a brutal century and draws comparisons with Kevin Pietersen as England thrash Sri Lanka by 119 runs in the first T20 in Southampton.
BBC15 Sept
Harry Brook hit 114 not out in the first innings set up England with a total of 254 proving to difficult for Sri Lanka to chase leading to a England win by 119 runs after bowling out Sri Lanka.
BBC15 Sept
England captain hits unbeaten 114 off 49 balls in first T20 Sonny Baker claims three wickets in 119-run victory As he nears the end of a hectic summer Harry Brook was offered the chance to rest rather than play this series and how Sri Lanka must wish Pakistan’s red-ball side had extended him enough to force a lay-off. As it turned out the 27-year-old could hardly have looked fresher as he inspired his side to an overwhelming win over emphatically outclassed opponents, a brilliant century powering them to a 19th victory in just 22 games since he took over the captaincy, secured by the margin of 119 runs. It was Brook’s second T20 century, making him the third Englishman to score more than one. He cavorted to triple figures off 42 balls of which precisely a third were dispatched to the boundary, six of them beyond it, and ended unbeaten on 114. But as much as his power impressed, using the size of the ground and manipulation of angles to maximum advantage, aided occasionally by the tourists’ imperfection in the field, he also scurried a succession of twos. Continue reading...
The Guardian•Simon Burnton at the Utilita Bowl15 Sept
Take a look at the best of Harry Brooks' sensational batting display against Sri Lanka during the first T20 test.
Sky Sports15 Sept
Watch the best of Harry Brook's sensational century against Sri Lanka from just 42 balls, the joint-second fastest hundred by an Englishman in a T20I.
BBC15 SeptLatest score from the first T20 international between England and Sri Lanka at the Utilita Bowl in Southampton. Watch live on Sky Sports Cricket.
Sky Sports15 Sept
While social media debates whether the dollar crashes overnight or dominates forever, a fundamental structural rewiring is quietly occurring. Sovereign nations are actively refinancing dollar denominated loans directly into Chinese yuan. This is not a sudden crash of the greenback, but a gradual bypass of the Western financial architecture. Who Is Doing This? The blueprint crystallized when Kenya finalized the conversion of its Chinese Standard Gauge Railway (SGR) loans converting roughly $3.5b to $5b from USD to RMB. Kenya shifted from floating Western benchmark rates (SOFR) to China’s Loan Prime Rate (LPR), slicing interest rates nearly in half and saving an estimated $215M to $250M annually. Following Kenya’s execution, Ethiopia entered bilateral agreements with the People’s Bank of China (PBOC) to restructure debt treatment, set up RMB trade settlements, and integrate its banks into CIPS (China's Cross-Border Interbank Payment System). Other debt distressed borrowers holding heavy Chinese bilateral loans including Zambia, Mozambique, and Sri Lanka are exploring or initiating similar bilateral currency swaps and redenomination models. How Does This Actually Affect the U.S.? These nations aren't dumping existing dollar balances. However, they are eliminating future demand for them. The Closed-Loop Financial Rail: When a country owes AMEX:USD , it must clear payments through New York correspondent banks and SWIFT. Redenominating debt into RMB cuts Western rails out entirely. The borrower sells raw commodities directly to China, earns RMB, and uses that RMB to service Chinese infrastructure debt via CIPS. The transaction never touches a U.S. bank or Wall Street clearinghouse. Blunting Sanctions Leverage: The primary enforcement mechanism of U.S. foreign policy has long been the threat of cutting off access to the dollar clearing system. As developing nations establish parallel, non-dollar debt and payment circuits, the coercive leverage of secondary financial sanctions weakens. Erosion of Passive Dollar Demand: Foreign central banks historically held massive foreign exchange cushions in U.S. Treasuries because global debt had to be paid in dollars. Redenominating external sovereign liabilities reduces the structural necessity to hoard dollar reserves over the coming decades. Hard Data to Track (Beyond Central Bank Gold Accumulation) While foreign central banks hoarding physical gold at multi decade records remains a visible sign of reserve diversification, the real operational plumbing shows up in institutional data. SAFE Cross Border RMB Share: Tracks the proportion of China’s own external trade and cross-border payments settled in yuan versus dollars. It has crossed 52%, with H1 cross-border trade settlements in RMB up over 31% year-over-year. A decade ago, this was near zero. U.S. Treasury TIC Data (Official vs. Private Divergence): Recent Treasury International Capital (TIC) releases show a clear structural split. Foreign private investors (hedge funds and asset managers capturing high nominal yields) continue buying, while foreign official accounts (central banks) frequently register net monthly outflows. Foreign states are no longer passively absorbing U.S. deficit issuance at historical rates. CIPS Network Trajectory: Clearing volume on China’s alternative to SWIFT has accelerated past an annualized $25T+ equivalent, connecting nearly 1,800 participating institutions across over 100 countries. Panda Bond Issuance: Foreign sovereign and supranational issuers tapping China's domestic bond market to borrow directly in RMB have pushed cumulative outstanding volume beyond RMB 500 billion, locking in 2 to 3% yields rather than issuing dollar debt. What Could Cause This to Speed Up? Aggressive Secondary Sanctions Overreach The primary accelerator of de-dollarization is the weaponization of the dollar itself. If the U.S. imposes broad secondary sanctions on major non-aligned nations (e.g., sanctioning Indian, Turkish, or Emirati banks for trading with China or Russia), it forces neutral countries to preemptively construct non-dollar settlement rails to protect their own trade flows. "Higher for Longer" U.S. Interest Rates The math behind Kenya and Ethiopia’s debt conversion was straightforward: paying 7.5% on floating USD loans versus 3% on Chinese RMB loans. If stubborn U.S. inflation or surging deficit supply forces U.S. yields back up, dollar debt service becomes unsustainable for emerging markets. Borrowers will actively demand debt conversion into lower-yielding currencies simply to avoid default. Official Pricing of Key Commodities Outside USD The petrodollar is the bedrock of non-discretionary dollar demand. If major energy or commodity exporters (such as Saudi Arabia, the UAE, or Brazil) move from settling bilateral volumes in local currencies to officially invoicing and benchmarking raw materials in yuan or multi currency baskets, global buyers will no longer need to hold massive structural dollar cushions. TGtg!