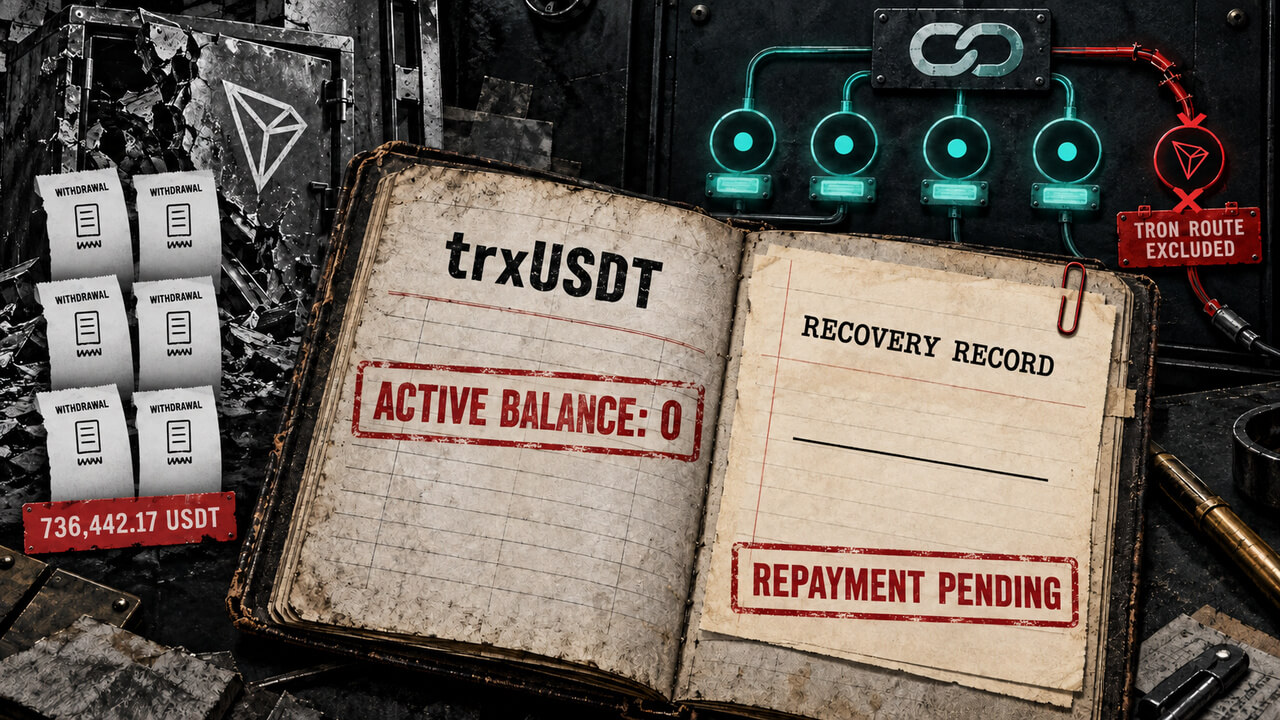
Chainflip to reset TRON USDT provider balances to zero following $736,000 exploit
Providers retain a separate on-chain record of what they are owed, but Chainflip has not disclosed repayment timing.
 CryptoSlate•Liam 'Akiba' Wright17 Sept
Providers retain a separate on-chain record of what they are owed, but Chainflip has not disclosed repayment timing.
CryptoSlate•Liam 'Akiba' Wright17 Sept
Seeing CRYPTOCAP:SOL push back to $100.xx and feeling the urge to FOMO buy? Take a step back and look at the market structure: 📌 TECHNICAL BREAKDOWN Wave (B) Corrective Push: Today's bounce from $96.83 is a textbook Wave (B) corrective retest, currently testing the 0.5 ($100.28) – 0.618 ($101.32) Fibonacci retracement cluster. Confluence Resistance: The descending channel trendline combined with heavy overhead supply blocks continues to cap any further upside momentum. Key Invalidation Level: As long as price remains below $106.93, the primary Bearish Impulse count pointing toward lower demand zones remains fully active. 💡 SPOT TRADING ACTION PLAN AVOID BUYING AT $100.xx: This is a No Man's Land. Buying inside Wave (B) offers a terrible Risk-to-Reward ratio. IDEAL BUYING SETUPS: Discount Scenario: Patiently wait for Wave (C)/(5) to complete near the main demand zone at $89.75 – $86.73. Breakout Scenario: Wait for a confirmed 4H candle close above $107.50 before flipping fully bullish. Protect your USDT/FDUSD cash position and let the market confirm its true direction! 🛡️ #Solana #SOL #CryptoAnalysis #TechnicalAnalysis #ElliottWave #BinanceSquare

Column has launched four new financial infrastructure products spanning stablecoins, card issuing, global banking and multicurrency accounts, giving fintech companies access to the services through a single banking platform. According to Column co founder William Hockey, the rollout completes a…

Upbit delayed JPYC trading to 3 p.m. KST on Sept. 17, while PYUSD kept its noon schedule across KRW, BTC and USDT markets.

☀️ Testing local breakout resistance near 99.62! Are you panic-selling this descending wedge accumulation, or locked in for the multi-wave breakout surge to the macro triangle resistance line? 🤔 Solana is executing a local descending wedge breakout following a major sell-side liquidity sweep down near $96.00 on this 2-hour Binance chart. SOL/USDT is trading around 99.62, pushing through the upper boundary of its local descending structure as institutional buyers step in to absorb sell volume and launch a multi-wave expansion campaign back up toward the upper boundary of the macro Triangle pattern. 📈💥 Look closely at the black blueprint trajectory mapping out the coming sessions. The algorithm projects a textbook multi-wave accumulation, retest, and expansion sequence: • An initial impulse push breaking above local descending wedge resistance toward the $100.80 - $101.00 region. ⚡ • A healthy higher-low pullback dipping back toward $99.80 - $100.00 to retest broken structure as new support and absorb remaining sell orders. 🌊 • A secondary expansion wave surging through intermediate structural hurdles to reach $103.50. 🧱 • A minor higher-low consolidation retest dipping back to $102.50 to solidify secondary launchpad support. ⚡ • Final acceleration surge driving straight up to target the macro horizontal Triangle pattern resistance ceiling near $107.00. 🎯🏹 Maintaining technical patience and aligning with trendline demand is your ultimate superpower in this setup. Trying to short directly into a confirmed descending wedge breakout following a deep sell-side liquidity sweep is a fast track to getting caught on the wrong side of an aggressive squeeze. Smart money is waiting for this higher-low retest above $99.00 - $100.00 to validate before riding the full recovery wave back to the macro ceiling. 🧘♂️⚡ 🛠 Trade Parameters: 🛒 Long Zone: 98.50 - 99.80 🛍️ 🛑 Stop-Loss: 2h close below 96.50 ❌ 💰 Take-Profit: 107.00 🎯 The retail bears attempting to short into this local wedge breakout are about to get caught offside as institutional buy volume takes total control. Stay focused, strictly manage your risk, and let the algorithm carry the trade up to our target. Maintain your composure through the waves, and we will see you up at the $107.00 resistance target ceiling! 🚀💎

Anchorage Digital has added institutional custody support for Etherlink and seven assets issued on the Tezos layer 2 network, including xU3O8, a token representing physical uranium. Anchorage Digital said institutional clients can now hold xU3O8, wrapped XTZ, stXTZ, USDT, USDC,…

AAVE/USDT is shown on the 1D Binance chart, trading around 122.20 USDT. Price remains below a clearly defined descending resistance trendline, formed by a series of lower highs since the 2025 peak. The recent rebound toward the trendline makes the 140–145 USDT zone the key breakout area. Key levels: Resistance: 140–145 USDT Current zone: ~122 USDT Support: 100–105 USDT Major support: 90–95 USDT Deeper support: ~60 USDT A daily close above 145 USDT could provide breakout confirmation. If confirmed, the chart structure could open a move toward approximately 180–200 USDT, with 200 USDT representing roughly +64% from the current 122.20 USDT zone. If price is rejected from the trendline and loses 100 USDT, the bullish breakout structure may weaken, with 90–95 USDT becoming an important downside zone. Watch for a confirmed daily breakout rather than treating the trendline test itself as confirmation.

Poland’s state energy company Orlen lost hundreds of millions of dollars after a covert plan to buy discounted Venezuelan crude using tether collapsed. Disappearing Millions and USB Drives A clandestine attempt by Poland’s state-controlled energy giant to purchase discounted Venezuelan crude using cryptocurrency has collapsed into one of the largest corporate and political scandals in […]
 Bitcoin.com News•Terence Zimwara17 Sept
💵 Coin: CRYPTOCAP:NEAR / USDT ⏳ Time Frame: 6D 📉 Pattern: Inverse Head & Shoulders (H&S) 📍 Current Price on Chart: approximately $2.66 🎯 Neckline: approximately $3.10 🟨 Key Support Zone: approximately $1.75 – $2.00 The NEAR/USDT chart shows a potential Inverse Head & Shoulders structure following a prolonged downtrend. The pattern consists of three main components: the Left Shoulder, Head, and Right Shoulder, with the neckline positioned around $3.10. At the moment, price remains below the neckline, meaning the pattern has not yet received full breakout confirmation. The $1.75–$2.00 area is an important support zone because it also represents the potential formation area of the Right Shoulder. --- 🧩 Pattern Breakdown — Inverse Head & Shoulders 🔹 Left Shoulder: Formed after a decline, followed by a rebound from the approximately $1.70–$2.00 area. 🔻 Head: Price then experienced stronger selling pressure and formed a low around $0.84, creating the lowest point of the structure. 🔹 Right Shoulder: After rebounding from the Head, price retraced toward the $1.75–$2.00 zone, but has not formed a new low below the Head. This structure resembles the formation of a Right Shoulder. 📏 Neckline: The main resistance is located around $3.10. A strong breakout and candle close above this level would provide an important confirmation that the Inverse H&S structure is beginning to validate. --- 🟢 Bullish Scenario 🚀 Main bullish confirmation: NEAR needs to break above and hold $3.10. 📈 If the neckline breakout is confirmed with strong momentum, the Inverse Head & Shoulders structure could develop into a bullish reversal pattern. 🎯 Key resistance levels shown on the chart: $3.76 → $4.60 → $6.00 → $8.00 → $9.00 🔥 $3.76 becomes the first resistance area after the neckline. 🚀 If price successfully breaks above $3.76, the next area to watch would be around $4.60. 📈 A breakout above $4.60 could open the way toward $6.00. 💥 Next, the $8.00 area represents an important psychological resistance level. 🏆 The area around $9.00 represents the highest target/projection displayed on the chart and is also close to the previous high around $9.004. ⚠️ However, these levels are technical resistance/target zones shown on the chart, not a guarantee that price will reach them. --- 🔴 Bearish Scenario ⚠️ The bullish scenario becomes weaker if NEAR fails to hold the $1.75–$2.00 support zone. 📉 If price breaks down below this zone, the Right Shoulder structure could become invalidated. 🔻 Further downside could increase the possibility of price revisiting lower support areas. 💀 The most critical level within this structure is the Head low around $0.84. 🚨 If price eventually breaks below and forms a lower low beneath the Head, the Inverse Head & Shoulders structure shown on the chart would experience significant invalidation. --- 🔑 Key NEAR/USDT Levels 🟨 $1.75 – $2.00 → Support / Right Shoulder Zone 🔴 $3.10 → Neckline & Major Resistance 🟡 $3.76 → First Resistance 🟡 $4.60 → Next Resistance 🟡 $6.00 → Major Resistance 🟡 $8.00 → Psychological Resistance 🟢 $9.00 → Previous High / Chart Target Area 🔻 $0.84 → Head / Critical Invalidation Area --- 📌 Conclusion 🧠 Structurally, NEAR/USDT is forming a potential Inverse Head & Shoulders pattern on the 6D timeframe. 🟢 Bullish: A breakout and confirmation above $3.10 could provide stronger validation of the reversal structure and shift attention toward $3.76, $4.60, $6.00, $8.00, and potentially $9.00. 🔴 Bearish: Failure to hold $1.75–$2.00 could weaken the Right Shoulder structure. A move back toward the Head, particularly below $0.84, would represent an important invalidation of the Inverse H&S structure. ⏳ For now, the $3.10 neckline is one of the most important levels to watch. ⚠️ DYOR — Technical analysis does not guarantee future price movements. #NEAR #NEARProtocol #NEARUSDT #Crypto
📊 Technical Analysis 💵 Coin: AMEX:ARB / USDT ⏳ Time Frame: 6D 📐 Pattern: Descending Channel 📍 Current Price: around $0.165 --- 📐 DESCENDING CHANNEL 🔻 ARB has been moving within a long-term Descending Channel, with price forming a sequence of Lower Highs and Lower Lows since the 2024 peak. 📉 The channel resistance is represented by the red trendline, which has continued to pressure price from above. 📈 The channel support is represented by the yellow trendline, which has acted as a reaction area near the lower boundary of the channel. 🟢 The middle channel line also acts as dynamic resistance/support, making price behavior around this area important to monitor. 💡 As long as ARB remains inside the channel, the long-term structure continues to show bearish pressure. However, as price approaches the upper resistance, the possibility of a breakout becomes increasingly relevant. --- 🟢 BULLISH SCENARIO 🚀 Bullish confirmation would become stronger if ARB manages to break out and close convincingly above the descending trendline (red line). 📈 If a breakout occurs, the horizontal resistance levels shown on the chart can be monitored progressively: 🎯 Target 1: $0.222 🎯 Target 2: $0.266 🎯 Target 3: $0.330 🎯 Target 4: $0.396 🎯 Target 5: $0.457 🎯 Target 6: $0.585 🔥 The $0.457–$0.585 area represents an important resistance zone on this chart structure. 💡 If price manages to break through this resistance and maintain a bullish structure, the move could develop into a long-term reversal, rather than simply a relief rally. ⚠️ However, the breakout should ideally be confirmed through a candle close, volume, and the ability of price to successfully retest the broken resistance. --- 🔴 BEARISH SCENARIO 🔻 The bearish scenario remains valid if ARB fails to break above the descending trendline and receives another rejection from the channel resistance. 📉 If price moves deeper back into the channel, the following support areas should be monitored: 🛡️ Support: $0.165 🛡️ Support: $0.120 🛡️ Major Support: around $0.090–$0.070 ⚠️ If ARB loses the lower support area and forms another Lower Low, the long-term bearish structure could continue. 📌 As long as price has not successfully broken out of the channel, the breakout should not be considered a fully confirmed trend reversal. --- 🧠 CONCLUSION 🔎 ARB is currently approaching an important area within its long-term Descending Channel structure. 📉 Bearish: Price remains below the descending resistance and gets rejected → potential continuation within the channel. 📈 Bullish: Breakout + close above the descending trendline → opens the possibility toward $0.222 → $0.266 → $0.330 → $0.396 → $0.457 → $0.585. 🔥 Therefore, the red descending trendline is the key structural level to watch. A confirmed breakout could represent an important change in ARB's long-term market structure. ⚠️ DYOR — Not Financial Advice. #ARB #Arbitrum #ARBUSDT #Crypto

ETHUSDT is trading around 2,418 USDT and remains within a descending channel. The current rebound lacks the strength to alter the market structure, as the price stays below the EMA89 (near 2,449) and overhead resistance continues to exert selling pressure. The 2,450–2,490 zone serves as a critical resistance area. If ETH rallies to this level but faces rejection—specifically below the EMA cluster and the channel's upper boundary—I lean towards a scenario where the price retreats to 2,380 before extending toward the primary target near 2,320 USDT. Macroeconomic factors and capital flows currently support a bearish outlook. The Federal Reserve recently raised interest rates by 25 bps and signaled the possibility of further hikes this year, driving the USD to a seven-week high and causing short-term yields to surge. Ethereum faces additional pressure following the failure of the CLARITY Act in the Senate; FXStreet reported a roughly 3.4% drop in ETH, alongside the largest single-day outflow from US spot Ethereum funds since January. The bearish scenario would be invalidated if ETH breaks out of the channel and establishes firm support above the 2,490–2,500 range.
BTCUSDT is trading around 76,230 USDT and remains within a descending channel. The current rebound lacks the strength to alter the market structure, as the price stays below the EMA34 (approx. 76,530) and EMA89 (approx. 77,200), while the pattern of lower highs persists. The 76,800–77,800 zone is a critical resistance area to watch. If BTC rallies to this region but faces rejection below the EMA cluster and the channel's upper boundary, I lean towards a scenario where the price drops to 75,000, followed by an extension toward the primary target near 74,000 USDT. Today's macroeconomic data reinforces the bearish outlook. The Fed has raised interest rates by 25 bps to the 3.75%–4.00% range, with most officials anticipating at least one more hike before year-end. Following this decision, the USD strengthened, Treasury yields rose, and US equities fell—creating an unfavorable environment for Bitcoin and risk-on assets. The bearish scenario would lose momentum if BTC breaks out of the channel and holds firmly above the 77,800–78,000 level.

Analysis is on the 4H: price ran a strong pole from the ~74 HL and is now consolidating in a bull flag near the highs. Execution is on the 1H for a tighter entry. Scenario 1 (primary): once the 4H confirms a break above the upper flag line, ideally with RSI reclaiming 50 and the Alligator opening up, I take the long on the 1H. Stop sits below the previous HL / lower flag line, or under the Alligator once it is confirmed. Scenario 2 (if the flag fails and price breaks down): watch the 0.5-0.618 fib zone (~92-87) for a bounce, entering only on a confirmed reaction such as bullish divergence or a reversal candle, at smaller size since it's the lower-conviction setup. Risk is fixed per trade; stops move to break-even and trail under structure as price advances, with targets extended to the next structural level. This is a spot, not a future. Momentum is currently soft (RSI ~40, Alligator bearish), so patience for confirmation is key. Not financial advice.

Zoomex’s TradFi Zone includes a set of ETF-linked perpetual contracts alongside its single-stock and commodity lineup, giving users USDT-margined exposure to broad index, sector, and leveraged ETF products through the same interface used for crypto derivatives. What an ETF perpetual is A traditional ETF gives investors diversified exposure to an index or sector without picking
 BeInCrypto•Zoomex16 Sept
Tether's strategic moves in gold financing and accumulation could reshape market dynamics, influencing both stablecoin reserves and gold trade.
 CryptoBriefing•Editorial Team16 Sept
USDC issuer Circle just launched its own chain, arriving to an arena already fielded by Tether and Stripe.

The USDC issuer just launched its own Layer 1, arriving to an arena already fielded by Tether and Stripe.

Aave has announced an Avalanche credit hub that will let institutions borrow USA₮ against tokenized assets as the RWA market exceeds $51 billion and Avalanche hosts more than $3.4 billion of the assets. Aave RWA Hub will turn tokenized assets…

Hi all so we have broken the daily support we are now on the 4HR timeframe and here is a technical view and setup for the short, see that we broke and retested. Lets see Best of luck all
Hi all so we have broken the daily support we are now on the 4HR timeframe and here is a technical view and setup for the short.