← Back to feed
19 sourcesTracking since 12 Sept, 07:55

NFT sales rise 6.8% to $46.8M as Bitcoin trades surge

Chronological coverage

  1. 16 September
  2. 15 September
  3. Follow-up15 Sept, 09:23

    Bitcoin Analysis: More up ahead?

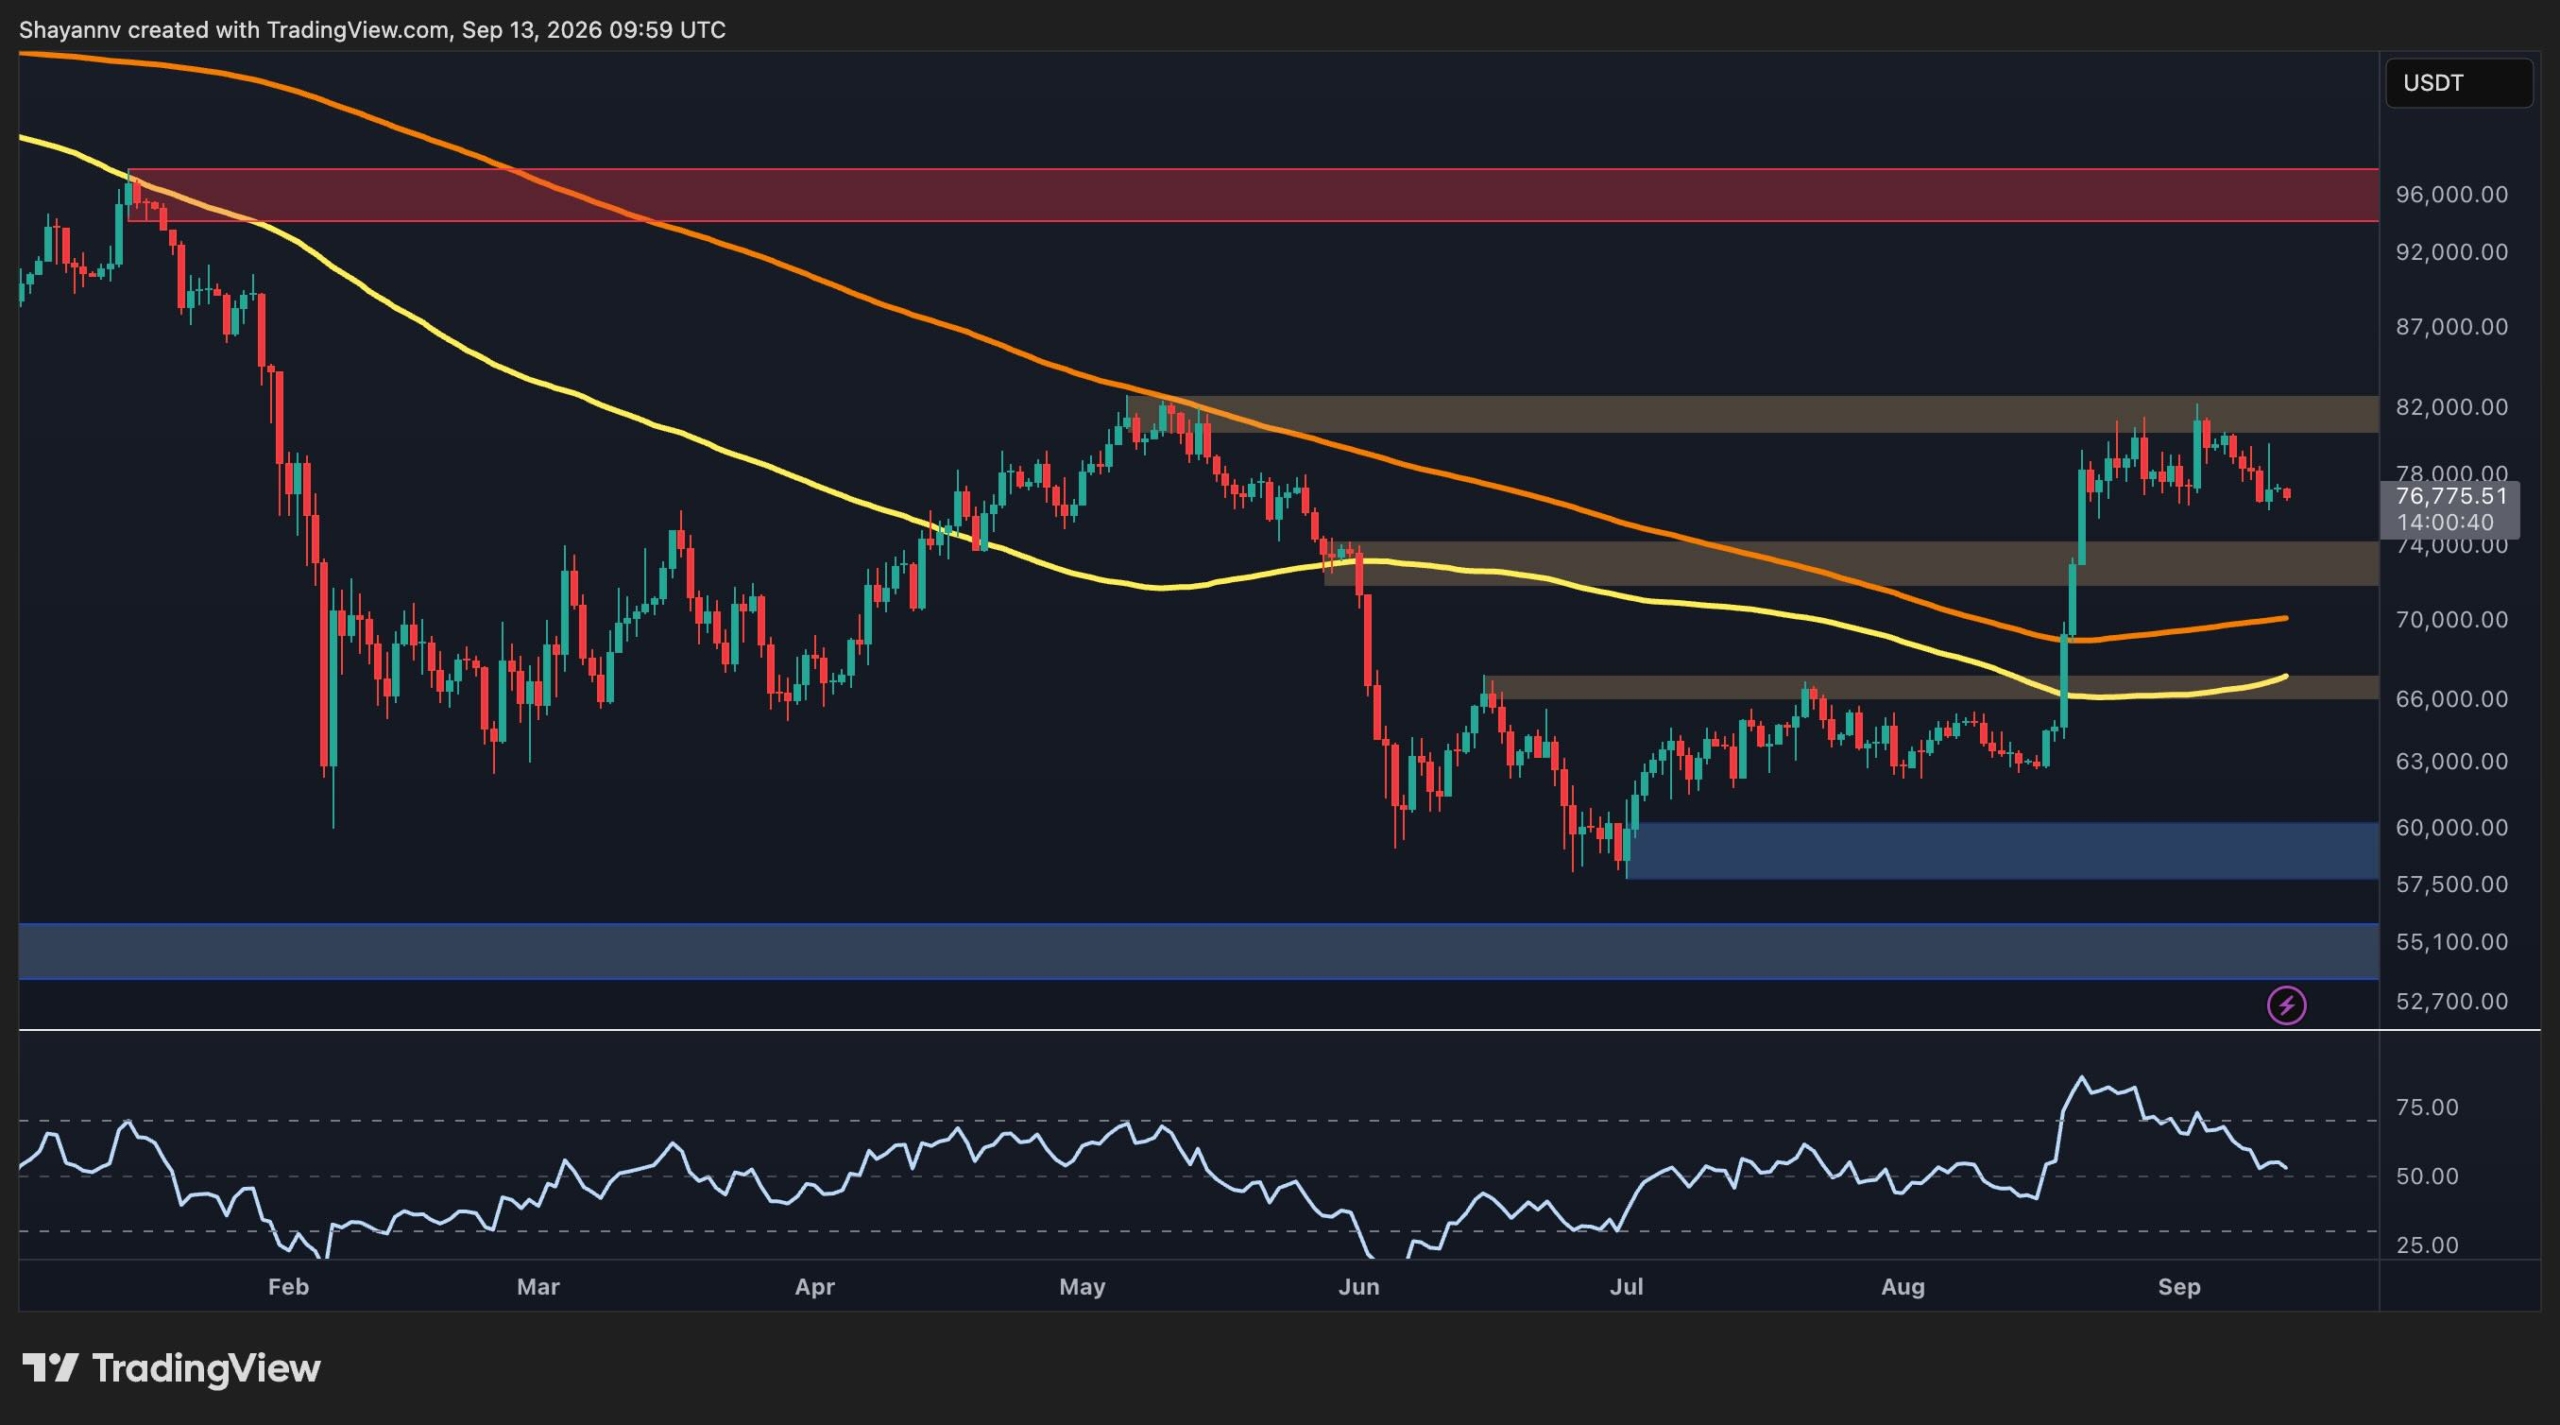
    Introduction We have been posting a lot of educational content so it’s time to share one of our analysis. Today’s chosen one is Bitcoin . Bitcoin has been stuck in a range between 76k-82k. But what direction do we think BTC is heading? 🗺️ Our plan After looking at the trend, volume, momentum, liquidity and identifying support and resistance zones we have noticed that Bitcoin has strong support around 76k which it hasn’t broken recently, when touched it has bounced up several times which can make it head to 82k. Note: 📝 Important Note: This analysis is valid if support at 76k isn’t broken. Btc price reaches 76k we bounce and head slowly towards 82k. After it reaches 82k we expect hard resistance because it needs to convert the resistance to support. If it holds at 82k we will have the launchpad we need for it to head to our final target 86k. We will leave images with the lines clearer. https://www.tradingview.com/x/hmju6QnN Conclusion We head to 82k ➡️Hard resistance➡️Resistance is turned into support ➡️Road cleared to 86k! ⚠️ Disclaimer ⚠️ This is not financial advice this is our long term view which we wanted to share with you all. Remember that there is news and other factors which could invalidate our position. 👇Want to know our view on another market? Leave it in the comments below!👇 🚀 Boost | 🔁 Share | 💬 Comment | ✅ Follow for more educational content Learn . Keep what works for you. Add your own edge! WFF

    TITradingView Ideas
  4. Follow-up15 Sept, 07:12

    Bitcoin Rejected at $80K Again — September Lows Back in Focus

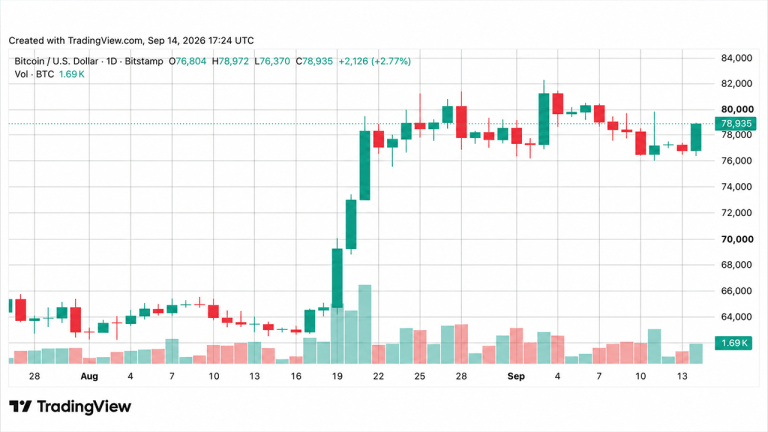
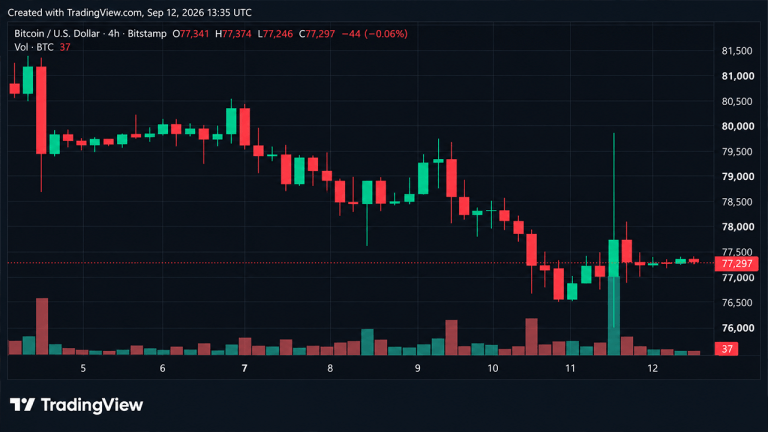
    Another Failure Around $80K Bitcoin sellers stepped in again yesterday as price failed around the $80,000 area for the third time. This produced another lower high, followed by three strong bearish candles. Short-Term Structure Weakens The repeated lower highs continue to show buyers struggling to build on rallies. Price has now fallen back towards the lower end of its recent range. Back Below the 100/50 EMAs Bitcoin has slipped below the 100/50-period EMAs, with both averages flattening and contracting. This adds to the short-term caution despite the averages technically remaining bullishly crossed. September Lows Back in Focus The $76,264 area remains the key support underneath price, with several strong reactions around this zone. A decisive break below it would force us to start questioning whether the recent medium-term uptrend is beginning to fail. Volume Offers Bulls Some Hope One positive is that volume has decreased during this latest pullback, showing no major increase in selling conviction so far. That could quickly change if price begins accelerating towards support. In Summary Bitcoin’s third failure around $80,000 has produced another lower high and a sharp bearish reaction, putting the September lows firmly back in focus. Price is also below the flattening 100/50-period EMAs, adding to the short-term weakness. However, declining volume on the pullback offers bulls some encouragement. The $76,264 area now looks pivotal; lose it with increasing selling momentum and the recent medium-term uptrend would have to be seriously questioned.

    TITradingView Ideas
  5. 14 September
  6. Follow-up14 Sept, 19:51

    Bitcoin Near a Major PRZ: Can BTC Hold Above $80,000?

    Bitcoin ( BINANCE:BTCUSDT ) moved higher over the past few hours following Trump’s tweet, while the announcement also supported a recovery in U.S. equities and triggered a temporary rise in Bitcoin and gold. BTC is now trading near the Potential Reversal Zone(PRZ) , the Cumulative Short Liquidation Leverage($80,620-$79,800), and the key trading level of $79,800. Can Bitcoin establish itself above $80,000, or is another correction about to begin? Macro Outlook The recent recovery in U.S. stock indices helped improve short-term risk sentiment and supported Bitcoin’s move higher. However, the current rally has not been accompanied by particularly strong trading volume, which keeps the risk of another correction alive. Technical Analysis From an Elliott Wave perspective, Bitcoin could still be developing a Triple Three Correction(W-X-Y-X-Z). BTC is also trading inside an important technical confluence formed by the PRZ, Cumulative Short Liquidation Leverage, and the key $79,800 trading level. Liquidation data shows approximately $909 million in short positions at risk above $80,600, making this area an important liquidity target. At the same time, approximately $807 million in long positions are at risk below $74,860, creating another major liquidity area on the downside. 💡 Educational Note: Large liquidation clusters can attract price because forced position closures create additional market orders, but reaching a liquidity zone can also trigger a sharp reversal once that liquidity is absorbed. I expect Bitcoin to start declining from the Potential Reversal Zone(PRZ) and the Cumulative Short Liquidation Leverage, with an initial target around $77,800. If bearish momentum increases, the correction could extend toward $76,600. Trade Setup First Take Profit(TP): $77,800 Second Take Profit(TP): $76,600 Stop Loss(SL): $80,890 Key Trading Levels: $79,800 _ $77,500 Which level do you think Bitcoin will reach first? 🔴 $76,600 🟢 $80,890 📌 Bitcoin Analysis(BTCUSDT), 2-hour time frame. 🛑 Always use proper risk management and set a Stop Loss(SL) for every position. 🚀 If this analysis helps your trading plan, a BOOST would help more traders discover it.

    TITradingView Ideas
  7. Follow-up14 Sept, 16:51

    Bitcoin Daily Analysis: EMA Support vs. $81,610 Resistance

    Bitcoin price action continues to show a constructive structure on the daily timeframe, with multiple daily candle closes holding above the EMA ribbon. The ribbon is currently acting as dynamic support, keeping the broader structure tilted toward a potential bullish continuation. The key level to watch is 81,610. A daily close above this region would provide stronger confirmation that buyers are regaining control and could increase the probability of a move toward the next major daily resistance around 96,960. Rather than assuming continuation, waiting for a confirmed close above 81,610 may provide a clearer indication that momentum is developing. For a potential entry, traders could monitor how price behaves around 81,610 after a confirmed breakout. A successful retest and hold of this area could offer a more structured setup, while rejection would suggest that the breakout lacks confirmation. On the downside, failure to reclaim 81,610, particularly if price loses the daily EMA ribbon, would weaken the bullish structure. In that scenario, price could rotate lower toward the next significant support around 73,800. Overall, the market remains at an important decision point. Holding above the EMA keeps the bullish scenario valid, while confirmation above 81,610 would strengthen the continuation case. ---------------------------------------------------------------------------------------------- UK residents: Don't invest unless you're prepared to lose all the money you invest. This is a high-risk investment and you should not expect to be protected if something goes wrong. Take 2 mins to learn more: coinjar.com/uk/risk-summary The article is an opinion expressed by the author at a point in time and does not represent the views of CoinJar UK Limited or CoinJar Australia Pty Ltd. Take care to consider the date of this article and be aware that this opinion is based on circumstances at the time of publishing. No responsibility or liability is accepted for any errors of fact or omission expressed therein. Past performance is not a reliable indicator of future results. This above article is not to be read as investment, legal or tax advice and it takes no account of particular personal or market circumstances; all readers should seek independent investment advice before investing in cryptocurrencies. We recommend you obtain financial advice before making a decision to use your credit card to purchase cryptoassets or to invest in cryptoassets.In the UK, it's legal to buy, hold, and trade crypto, however cryptocurrency is not regulated in the UK. It's vital to understand that once your money is in the crypto ecosystem, there are no rules to protect it, unlike with regular investments. You should not expect to be protected if something goes wrong. So, if you make any crypto-related investments, you're unlikely to have recourse to the Financial Services Compensation Scheme (FSCS) or the Financial Ombudsman Service (FOS) if something goes wrong. ---------------------------------------------------------------------------------------------- EU residents: Warning: If you invest in this product, you may lose some, or all, of the money you invest. The value of crypto-assets may rise or fall rapidly. Past performance is not indicative of future results. To learn more see our Risk Disclosures. CoinJar Europe Limited is authorised by the Central Bank of Ireland as a crypto-asset service provider (registration number C496731) ----------------------------------------------------------------------------------------------

    TITradingView Ideas
  8. Follow-up14 Sept, 16:48

    Bitcoin 3D/1W: Weekly Alignment Weakens, Breakout Still Unconfir

    Bitcoin’s latest weekly assessment adds an important layer to the recent 3D weakness. The larger structure remains constructive, but the shorter-term picture is still corrective. On the weekly timeframe, BTC has lost full alignment, while the 3D structure continues to print lower highs and lower lows. That matters because the weakness is no longer visible only on the shorter timeframe. At the same time, the evidence still does not establish a broader structural breakdown. The current read is therefore mixed rather than binary: larger structure constructive; shorter-term correction unresolved. The monitored 3D breakout also remains unconfirmed. The latest completed 3D candle closed at $77.26K, below the active $81.47K structural level. This distinction is important. A structural level being tested is not the same thing as confirmation through a completed close, and the absence of confirmation does not automatically make the broader structure bearish. The clearest discriminating condition remains a completed 3D close above the active structural level. Until that evidence appears, the breakout remains unconfirmed. A new weekly close or a material change in the 3D structure would require reassessing the current stance, rather than extrapolating the present correction indefinitely. The main takeaway is not that Bitcoin has entered a confirmed bearish structure. It is that the correction has become relevant enough to reach the weekly layer, while the larger structure has not yet broken down. Confirmation over prediction.

    TITradingView Ideas

  9. 13 September
  10. 12 September