CLARITY Actpage 10

Product · 1607 articles
Share

Coverage, page 10

page 10 of 81

BITCOIN Clarity Act FAILED. Another Shock-another Top? Fed ahead

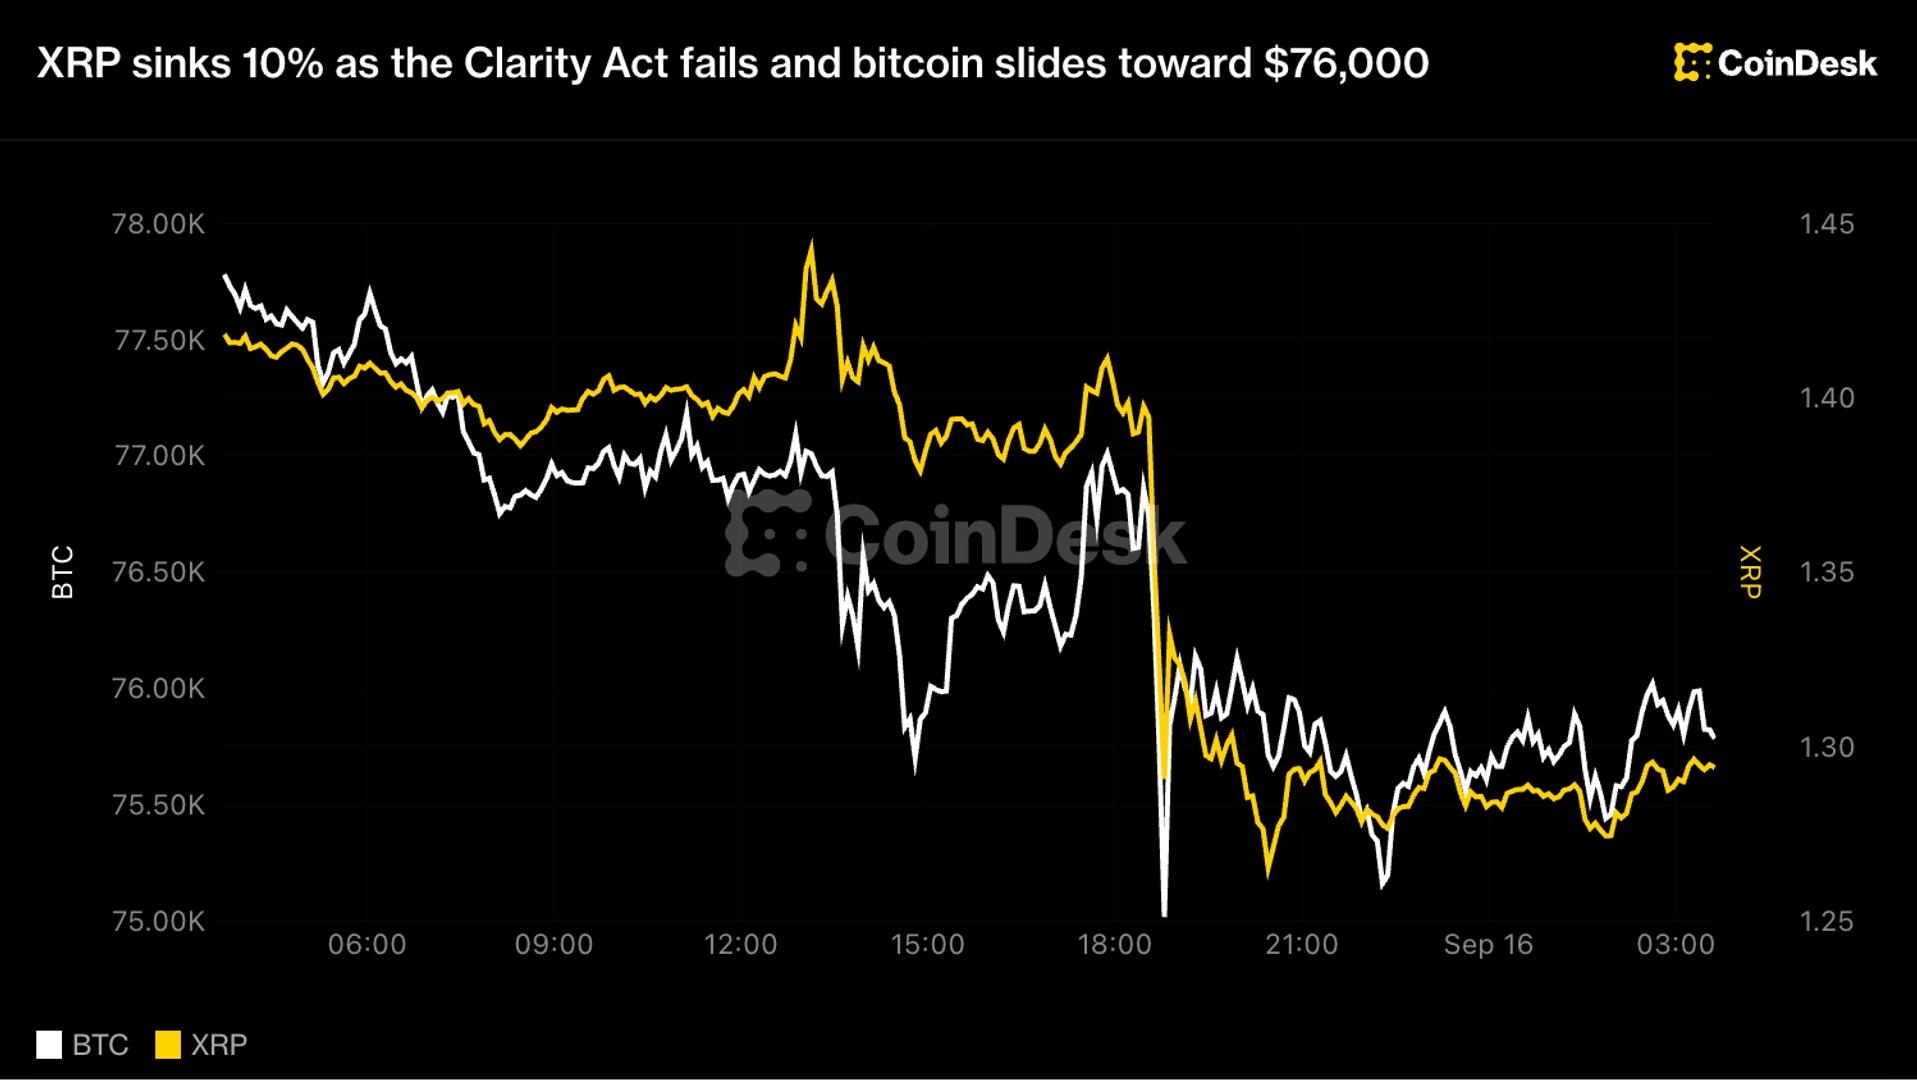
Bitcoin (BTCUSD) saw the Clarity Act failing again and now the market focus shifts towards today's Fed Rate Decision and more importantly Chair Warsh's tone during the Press Conference. In the very probable event that the Fed hikes, if Warsh sets the narrative for more upcoming hikes, those news can act as a catalyst to confirm the technical bias. Which following the 1W MA50 (blue trend-line) rejection, are bearish. In fact, every BTC market Top (and subsequent Lower Highs of the Bear Cycle) since last October, had a similar catalyst (set of macro events/ news) that confirmed the Top and kick-started the bearish reversal and sell-off (technical Bearish Leg) that followed. Notice also that even their 1D RSI patterns have been similar, all starting on overbought (RSI > 70.00) territory. October 2025 was due to the U.S. - China tariff escalation. January 2026 evolved around tariffs leading to massive ETF outflows. May 2026 formed on hot CPI, PPI readings on rising yields. The last two Lower Highs in particular formed a Resistance Zone (red). Similarly the last Lows (June 2026) have formed a Support Zone. This is critical as the first line of defense on this Support Zone is the 1W MA200 (orange trend-line), sitting exactly on its top. As a result, if the Fed confirms today the 1W MA50 rejection, the fair technical Target of a potential new Bearish Leg would be the 1W MA200 at around $66000. A -30.38% total drop, same as May-June, would price that closer to $57200. Do you think the Fed can trigger such drop today or BTC will break and close above its 1W MA50 and confirm the new Bull Cycle? Feel free to let us know in the comments section below! --- ** Please LIKE 👍, FOLLOW ✅, SHARE 🙌 and COMMENT ✍ if you enjoy this idea! Also share your ideas and charts in the comments section below! This is best way to keep it relevant, support us, keep the content here free and allow the idea to reach as many people as possible. ** --- 💸💸💸💸💸💸 👇 👇 👇 👇 👇 👇
TITradingView Ideas16 Sept

XRP/USD Blueprint: Key Supply Targets & Risk Levels to Watch

🔥 XRP/USD | Capital Flow Blueprint Plan (Day/Swing Trade) 🚀 📊 My Analysis XRP/USD is currently oscillating around $1.40 - $1.41, consolidating following a recent intraday spike that encountered strong technical resistance. On the daily chart, price action is holding above key structural support, with institutional liquidity forming a potential springboard. Market participants are watching for a high-volume confirmation candle to establish directional momentum out of this range. 📈 My Market Bias Bullish continuation bias over the medium term, contingent on defending structural demand and absorbing overhead supply. 🎯 Possible Scenario - Trigger: A sustained daily close above the immediate liquidity zone ($1.42 - $1.45). - Path: Clean breakout -> Liquidity sweep of minor swing highs -> Push toward higher structural supply zones. - Target Zone: The upper heavy resistance & liquidity barrier ("Police Barricade Zone") at $1.5500. This area acts as a strong institutional supply level, overbought confluence, and potential bull trap where dynamic reversal risks increase. Traders should manage exposure and secure profits accordingly. 🛡️ Areas I Am Watching - Key Entry / Accumulation Zone: Market execution across established value levels between $1.3500 and $1.4000, aligning with key Fibonacci retracements and dynamic demand. - Stop Loss (Invalidation Level): $1.2000 (Structural pivot support). * Disclaimer: Dear Ladies & Gentlemen (Thief OGs), this is my personal technical invalidation mark. Setting your SL is entirely your own choice and risk management responsibility! - Take Profit Target: Final Target @ $1.5500 ("Police Barricade Zone"). * Disclaimer: Dear Ladies & Gentlemen (Thief OGs), I do not mandate or recommend adhering solely to my TP level. Take profits at your own discretion and manage your trade at your own risk! 🧠 Educational Breakdown 1. Liquidity Pools & Traps: Higher timeframe resistance zones often attract heavy stop-orders and breakout buyers, creating high-volatility "trap" conditions. Identifying these zones allows traders to execute structured exits before potential mean-reversion pullbacks occur. 2. Market Structure: Respecting invalidation pivots ($1.2000) maintains a strong risk-to-reward ratio while safeguarding against unexpected volatility expansion. 🔗 Correlated Markets & Related Assets to Watch - $BTC/USD (Bitcoin): Trades as the macro sentiment leader for digital assets (~$76,800). XRP exhibits a strong positive correlation with BTC; a breakout in Bitcoin provides macro tailwinds for altcoin expansion. - $ETH/USD (Ethereum): Core gauge for smart contract platform liquidity (~$2,475). Strong ETH performance confirms healthy risk-on appetite across major crypto assets. - TVC:DXY (U.S. Dollar Index): Inversely correlated macro anchor (~99.60). Broad U.S. Dollar weakness typically acts as a catalyst for capital inflows into crypto assets like XRP/USD. - CRYPTOCAP:RLUSD (Ripple USD Stablecoin): Utility-driven stablecoin liquidity on the XRP Ledger. Expansion in RLUSD issuance enhances overall XRPL network activity and capital velocity. 📰 Latest Real-Time Fundamental & Economic Factors - Regulatory Legislation (U.S. Senate Vote): The U.S. Senate is deliberating on key crypto market structure legislation (the CLARITY Act). Political developments regarding full statutory classification continue to serve as a high-beta volatility driver for XRP. - On-Chain Protocol Upgrades: The XRP Ledger (XRPL) ecosystem is evaluating major technical amendments (including Batch V1.1 for atomic multi-transactions and institutional feature packages in xrpld 3.3.0). Validator consensus timelines are actively influencing short-term market sentiment. - Institutional Product Flows: U.S. Spot XRP ETF products continue to report measurable net daily inflows, elevating total net AUM ($1.22B+) and establishing a structural institutional floor. - Macro Environment & Federal Reserve: Broad market sentiment remains attuned to upcoming Federal Reserve interest rate decisions and global liquidity conditions, influencing risk-asset positioning. 🥷 Thief Trader Style Wishes & Motivation Quotes - "We don't predict the market, Thief OGs — we adapt to its footprints, strike with precision, and vanish into the green!" 💰✨ - "Protect your capital first; the profit will chase the patient hunter. Trade safe, manage risk, and bag those pips!" 🐺📉📈

TITradingView Ideas16 Sept

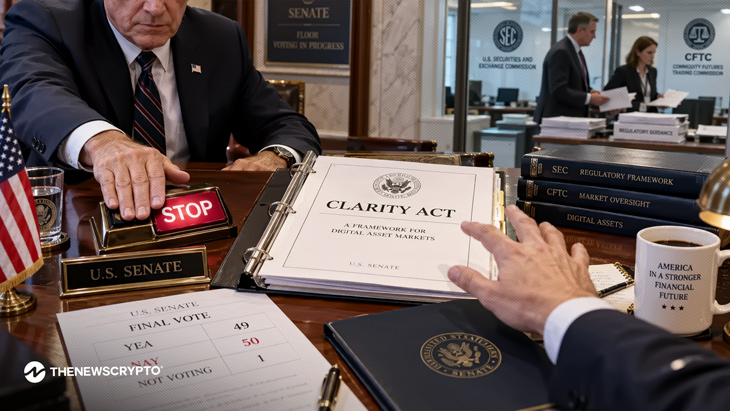
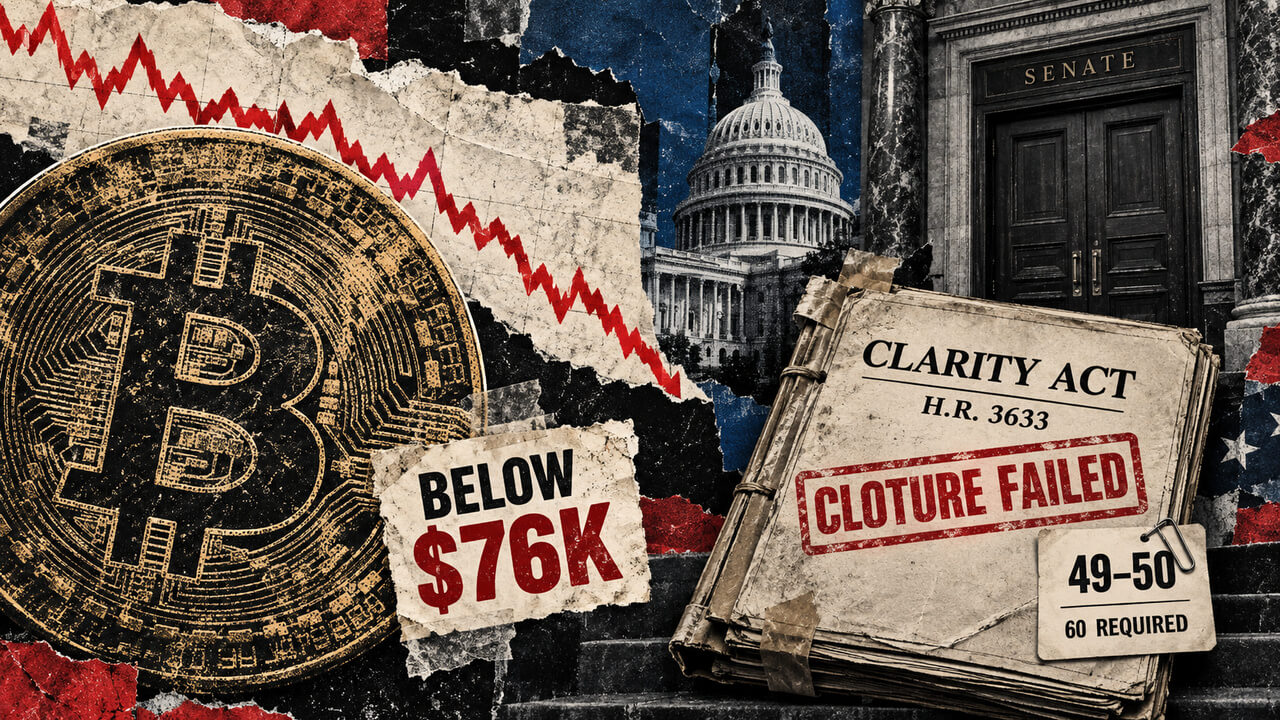
Senate crypto clarity bill fails cloture vote, bitcoin slides

BTCUSD | 4H Technical Analysis — Sep 16, 2026 Bitcoin is under pressure after the US Senate failed to advance the Digital Asset Market Clarity Act, the comprehensive crypto market structure bill the industry has spent years lobbying for. A procedural vote to bring the bill to the floor fell short 49 to 50, well below the 60 votes needed for cloture, plunging crypto-related stocks including Coinbase and reigniting uncertainty over whether the CFTC will ever gain the unified regulatory authority the industry has been seeking. The sell-off was compounded by broad risk aversion ahead of tomorrow's FOMC rate decision, with markets reluctant to add risk into a binary macro event on top of the fresh regulatory setback. BTCUSD spent nearly three months, June through mid-August, chopping in a wide 58,000 to 67,000 range before a sharp spike in late August drove price directly to 70,000 and beyond, clearing the entire range in a matter of days. That move extended into early September, with price tagging a high near 82,000 before rolling over into a descending channel that has been in place ever since. The channel's upper boundary has capped every bounce near 80,000 to 82,000, while the lower boundary running through 74,300 has held on each retest so far. Price is now trading around 76,000, with the fast EMA at 77,055 just below the slow EMA at 77,626, a mildly bearish signal that reflects the stalling momentum since the early September peak. RSI has fallen to 36.72, its lowest reading since the pre-breakout consolidation in July and August, showing the Senate news and FOMC anxiety are actively pressuring price rather than just causing a pause. The 74,300 level is the one that matters most right now. It is both the descending channel's lower trendline and the same shelf that has provided support on at least two prior tests since the channel formed, making it the clearest line between an orderly pullback and a deeper breakdown back toward the August range. Key levels to watch: Resistance: 78,000 (recently lost support) / 82,000 (early September high) / 86,000 Support: 74,300 (channel lower trendline, prior support) / 72,500 / 70,000 (breakout level from the August range) Bear case: The failed Clarity Act vote removes a key regulatory tailwind the market had been pricing in, and with the FOMC decision still pending tomorrow, positioning is likely to stay defensive. A break below 74,300 would confirm the descending channel is resolving lower rather than consolidating, opening a retest of 70,000 and potentially the top of the old 60,000 to 67,000 range if risk sentiment deteriorates further around the rate decision. Bull case: The Clarity Act failure was a procedural setback, not a permanent rejection, and legislative efforts of this kind typically get reintroduced rather than abandoned outright. If the FOMC decision tomorrow leans dovish or simply removes uncertainty, a bounce off 74,300 back above 78,000 would suggest the pullback was sentiment-driven rather than structural, keeping the broader uptrend from the August breakout intact. Bias is neutral to cautiously bearish while price holds below 78,000, with the FOMC decision tomorrow the more immediate catalyst than the crypto-specific regulatory news. The descending channel and falling RSI both argue for near-term weakness, but 74,300 has held before and remains the level that decides whether this is a routine pullback within an uptrend or the start of a larger correction back toward the summer range.

TITradingView Ideas16 Sept