Ethereum — page 16

Coin · ETH · 2951 articles
Share

Coverage, page 16

page 16 of 148

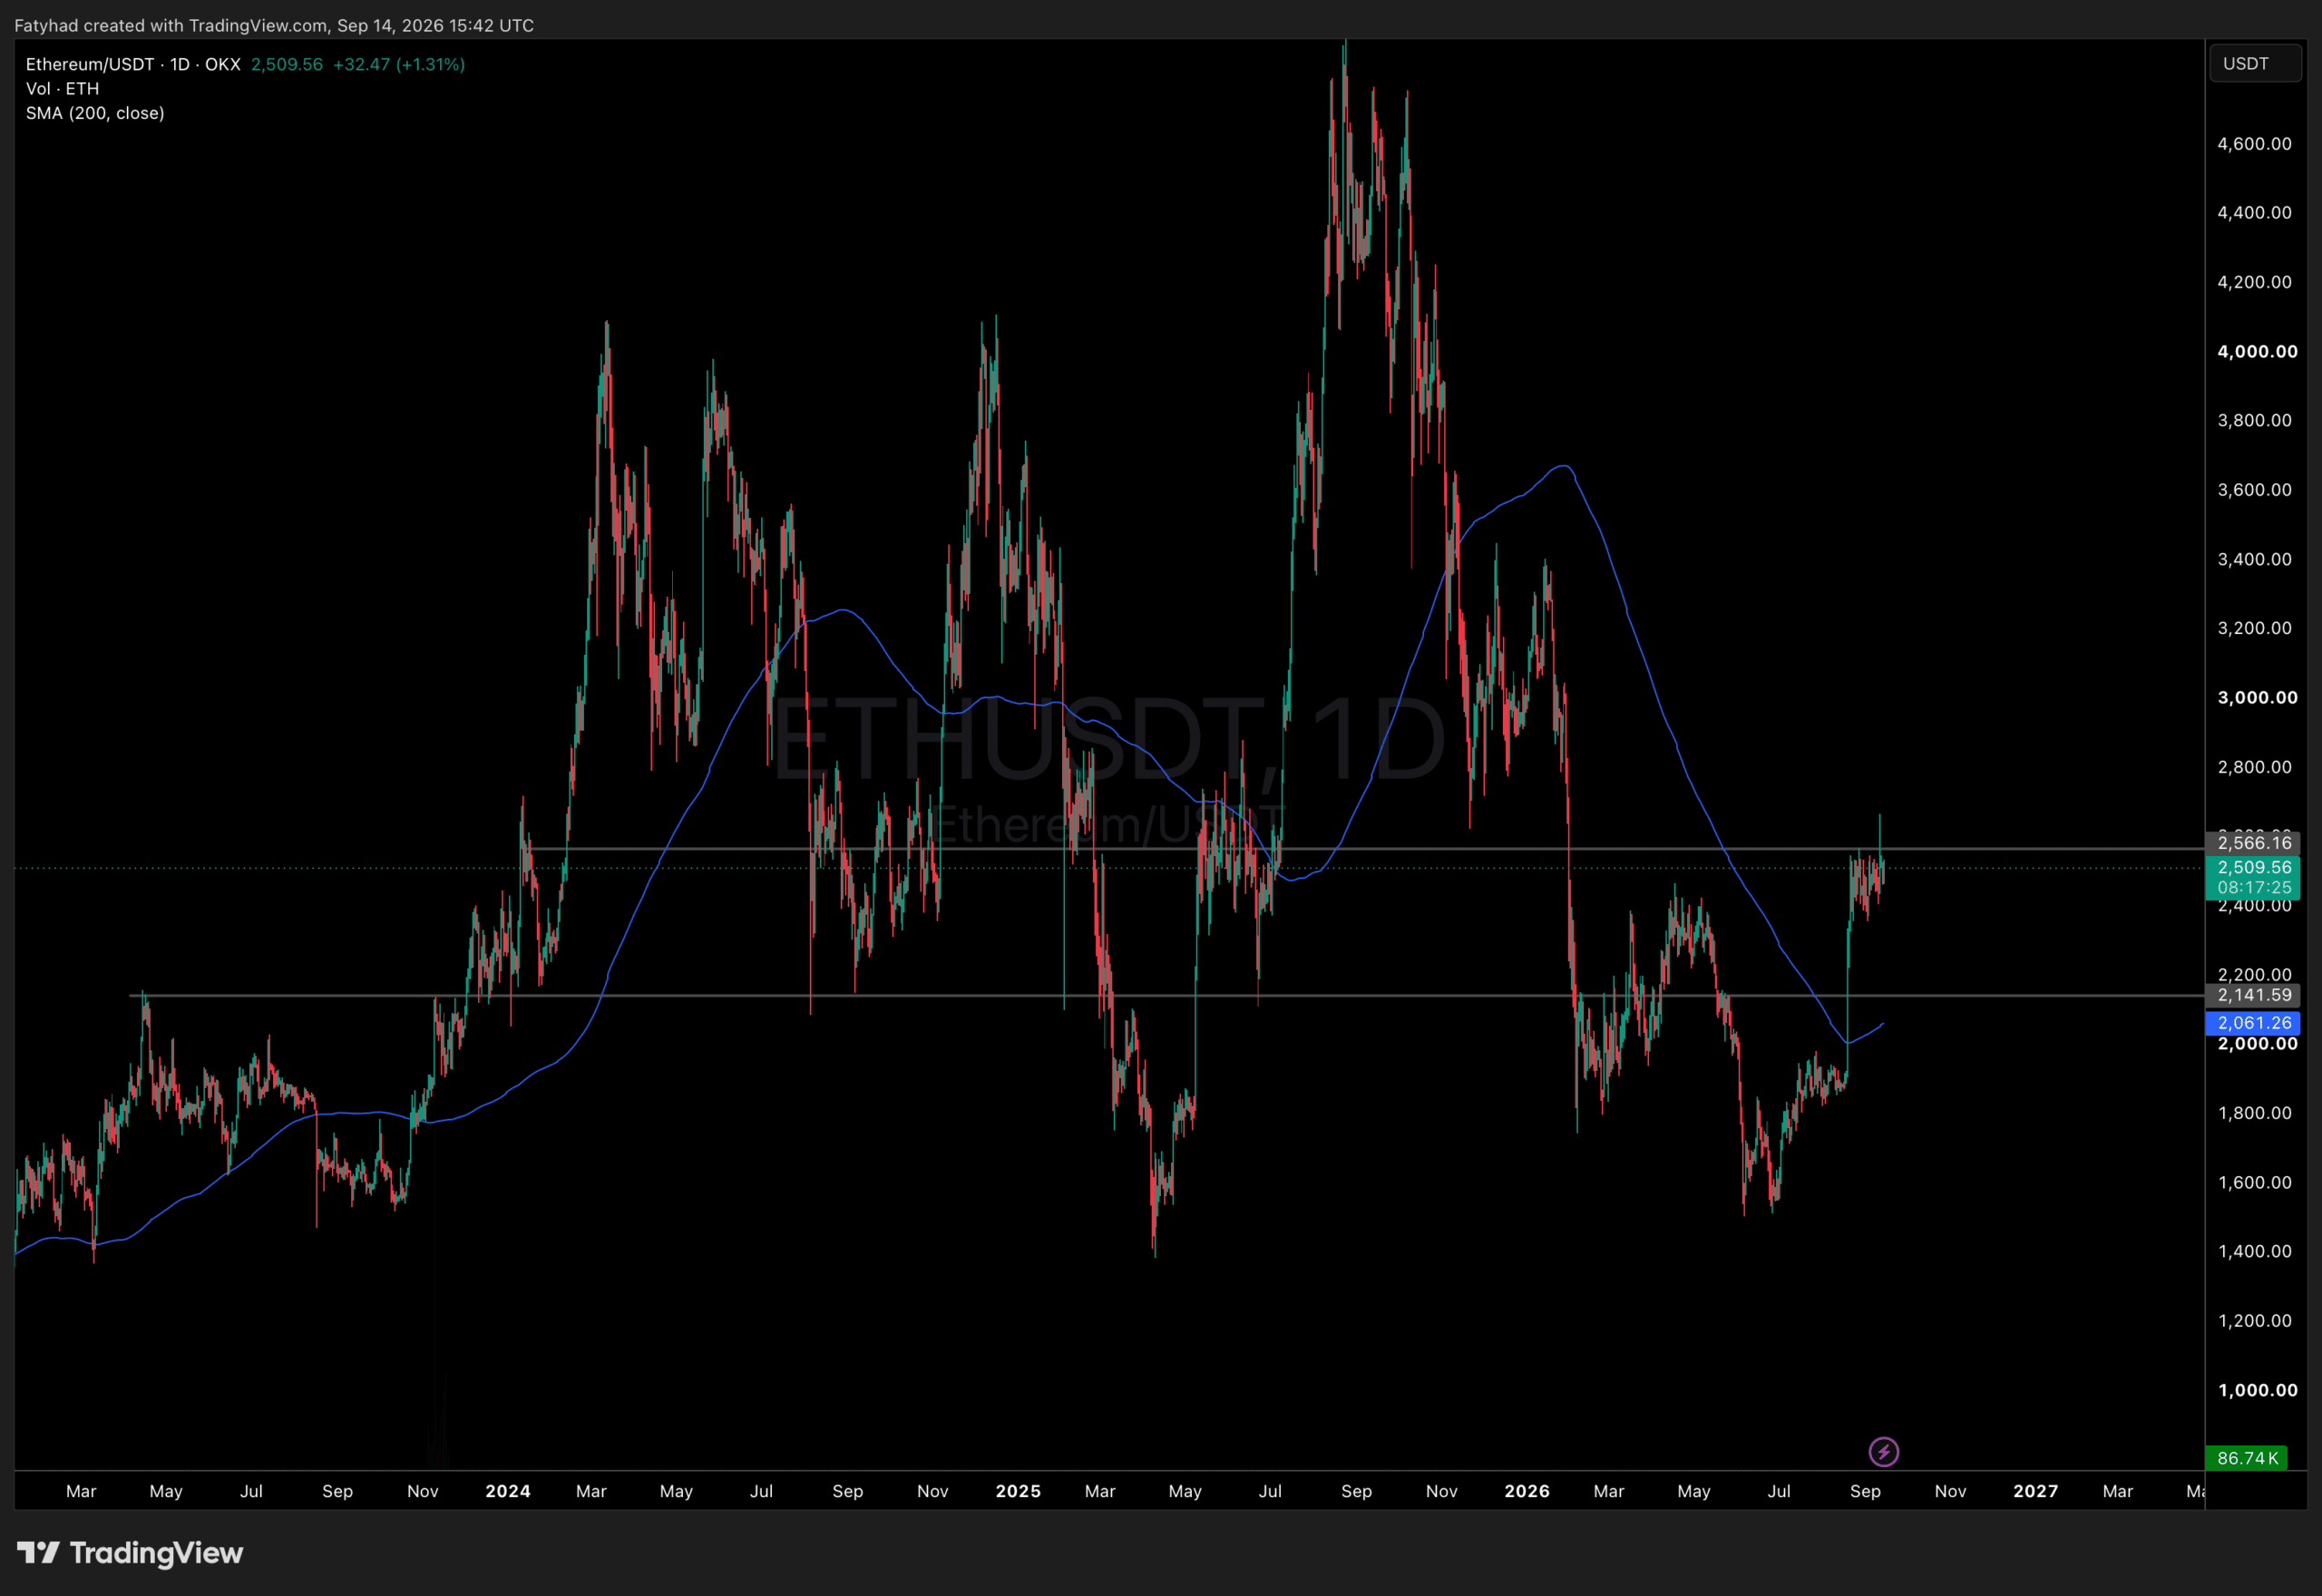
ETH - The Battle at the 200

I have many more posts coming for ETH outlining different structures, but for now I just want to take a simple look at the 3-day chart. The 200 EMA Many people overlook the 3-day chart, but it has been providing one of the clearest signs of what is happening with ETH's current price action. Starting with the 200 exponential moving average (dark blue), ETH has continued to respect all candle closes below the 3-day 200 EMA. Every time price approaches it and gets rejected on the close specifically, it reinforces that sellers are actively defending that level rather than buyers just failing to reach it by chance. The 200 SMA Now let's look at the 200 simple moving average (sky blue). What is interesting here is that the pump ETH saw on September 11, 2026 brought price to a high of $2,666, an almost perfect test of the 200 SMA as resistance (red arrow). This came right in line with ETH/BTC printing a double top that I outlined in this idea: https://www.tradingview.com/chart/ETHBTC/sCX1uixw-ETH-BTC-Potential-Double-Top-Forming/ A Massive Week Ahead Tomorrow is a big day. With the CLARITY Act heading to a Senate vote tomorrow and FOMC landing on Wednesday, ETH is about to either respect this structure, leading to a large downside drop, or close its first candle above resistance, which could provide the fuel needed to push toward the $3,000 level. ETH closes another 3-day candle tomorrow, so pay close attention to whether that close occurs once again below the 200 EMA, or whether this becomes the first 3-day candle of the current trend to finally break above it. One thing ETH does have going for it from the bullish side is that it is maintaining overbought conditions on the 3-day RSI. This shows there may still be enough underlying strength for one more push to the upside. However, if ETH closes the 3-day candle back below the 200 EMA and also breaches back inside the RSI channel, that would be the signal for the drop to begin instead.

TITradingView Ideas14 Sept

Target Zone: 2887.66

Hello Traders, Nice to see you all. If you follow me, you can always receive new updates quickly. Have a great day today. ------------------------------------- https://www.tradingview.com/x/qlYlpeAd/ ETH's volatility period is expected to continue until September 15. Since the current flow of funds is moving sideways with a bearish bias, it may be difficult for the price to sustain an upward trend. https://www.tradingview.com/x/X9QUS5RA/ https://www.tradingview.com/x/pomGQ6uw/ For the flow of funds to improve, I believe the upward gap expansion in USDT and USDC should continue. Therefore, it is important to monitor whether ETH can find support around 2510.94 and move higher. If the price rises, the key point will be whether 2887.66 can act as support. - Thank you for reading to the end. I wish you successful trading.

TITradingView Ideas14 Sept

ETHUSD | Supply Zone Rejection Points to Possible Pullback

Ethereum has rallied back into a significant higher-timeframe supply zone around 2625-2635, where sellers stepped in aggressively and rejected price. The chart shows a previous bearish structure followed by a corrective recovery into resistance. After reaching the highlighted supply area, price produced a strong reaction and is now attempting to move lower. As long as the supply zone remains respected, the probability of a deeper retracement remains on the table. 🎯 Bearish Targets ✅ Target 1: 2520 ✅ Target 2: 2475 ✅ Target 3: 2435 📊 Technical Outlook 🔹 Strong rejection from HTF supply zone 🔹 Previous bearish trend structure remains relevant 🔹 Buyers failed to sustain momentum above resistance 🔹 Potential retracement toward lower liquidity areas ⚠️ A sustained break and acceptance above 2635 would weaken the bearish scenario and suggest buyers are regaining control. This analysis represents a possible market scenario based on price action and chart structure. Always use proper risk management.

TITradingView Ideas14 Sept
TI

The Jailbreak plan for Altcoins

This chart is the "Master Key" to your entire Altcoins portfolio.You are looking at the OTHERS on the 3-Month (Quarterly) Timeframe. This chart excludes the giants (Bitcoin/Ethereum) and represents the "strength" of the mid/low-cap altcoins . the "Jailbreak" plan for Altcoins. The Macro Verdict: The "Apex" Moment This is not just a chart; it is a countdown.The Diagonal "Lid": That long blue diagonal line is the Macro Bear Market Resistance. It has suppressed altcoins since the 2021 peak.The Touch: Look closely at the current candle (the red one on the far right). It is literally kissing the trend line.The Timer: it has 16 Days and 6 Hours left in this 3-Month candle. The Bull Case: If this candle closes (in 16 days) outside or on top of that blue line, it signals the start of a 2-year Altcoin Super-Cycle. The Bear Case: If it rejects and closes deep red, your Altcoins will bleed for another 3-6 months. Elbow Theory" Applied to the Levels: The blue horizontal lines are the "Rungs of the Ladder." In my "Arm" metaphor, the price is currently "pinned to the floor" by the diagonal line. It needs to break the pin to stand up.The Breakout Trigger ($0.1466):This is the first horizontal blue line.Significance: This is the "Elbow Joint." Right now, the arm is trapped. Breaking 0.146 is the "flex" that confirms the arm has strength. Once this breaks, the path to 0.21 is nearly vertical. The "Altseason" Zone ($0.18 - $0.21): the next two lines represent the "Forearm."When the ratio hits this zone, this is when the "Zombie Coins" will suddenly wake up and print those 50-100% candles. This is where the Limit Orders will start getting hit.The "Mania" Peak ($0.39):This is the top line. This is the "Middle Finger" distribution top. If the ratio hits this, you should have zero crypto left. You should be 100% in cash. The RSI Reset (Hidden Bull Signal) Look at the top panel (RSI 14).Value: 45.29. Structure: Notice how the RSI line has reset from the "Overbought" highs of 2021 (80+) back down to the mid-40s. The Divergence: It is starting to curl sideways/up while price is still low. This is a Macro Momentum Reset. The tank is refilled. The RSI has plenty of room to run back to 70 or 80, which supports this thesis of a massive breakout. Final Strategy Command The Plan:Watch the Quarterly Close (in 16 days).If it closes above the diagonal 0.1466: Do nothing. Just wait. Targets are given above. The risk: If BTC dumps before the close, this candle could wick down. But structurally, this is the most "coiled" spring in the entire crypto market. Now let the 16-day clock run down.

TITradingView Ideas14 Sept

ETH/USDT — Bullish Move Toward Resistance

ETH/USDT is showing bullish momentum on the 1H chart after holding the support zone around **$2,410–$2,420**. Price is currently trading near **$2,532**, with buyers attempting to push through the nearby resistance. 🎯 **Target 1:** $2,577 🎯 **Target 2:** $2,630–$2,640 resistance zone A sustained move above **$2,540–$2,550** could strengthen the bullish continuation toward the targets. Watch for confirmation and manage risk carefully. **Bias:** 🟢 Bullish **Key Support:** $2,410–$2,420 **Key Resistance:** $2,630–$2,640

TITradingView Ideas14 Sept

ETH/USDT — Short Setup | 15M

Ethereum is showing signs of bearish momentum on the 15-minute timeframe. I’m watching the current structure closely for a confirmed breakdown and continuation to the downside. A clean break and retest of the key support area could provide a strong short opportunity. 🎯 Targets: Lower support levels 🛑 Invalidation: If price reclaims the key resistance zone ⏱️ Timeframe: 15M Patience is key — I’m waiting for confirmation before entering. Let’s see how this plays out. 📉

TITradingView Ideas14 Sept