C
Stocks stage a comeback after Fed-induced declines — plus, what's ailing Boeing
The Investing Club holds its "Morning Meeting" every weekday at 10:20 a.m. ET.
- critical toward Boeing · 90%
The Investing Club holds its "Morning Meeting" every weekday at 10:20 a.m. ET.

Trump's restraint may enhance the Fed's autonomy, potentially stabilizing market expectations and supporting future monetary policy decisions.
 CryptoBriefing•Estefano Gomez17 Sept
The Federal Reserve's first rate increase since 2023 barely dented crypto prices, but what comes next could change calculations on Wall Street.

The Fed's rate hike signals a challenging macroeconomic environment, potentially stalling Bitcoin's recovery and impacting investor sentiment.
CryptoBriefing•Editorial Team17 Sept
The Fed's rate hike signals ongoing inflation concerns, impacting market dynamics and highlighting Bitcoin's resilience amid regulatory challenges.
CryptoBriefing•Editorial Team17 Sept
Bitcoin has struggled to hold an advance above $76,800 after U.S. initial jobless claims fell by 10,000 to 196,000, strengthening the case for the Federal Reserve to keep interest rates elevated after its latest increase. US jobless claims strengthen the…

Bitcoin made modest daily gains as US stocks saw upside in the aftermath of the US Federal Reserve’s first interest-rate hike since July 2023.
 Cointelegraph•Cointelegraph by William Suberg17 Sept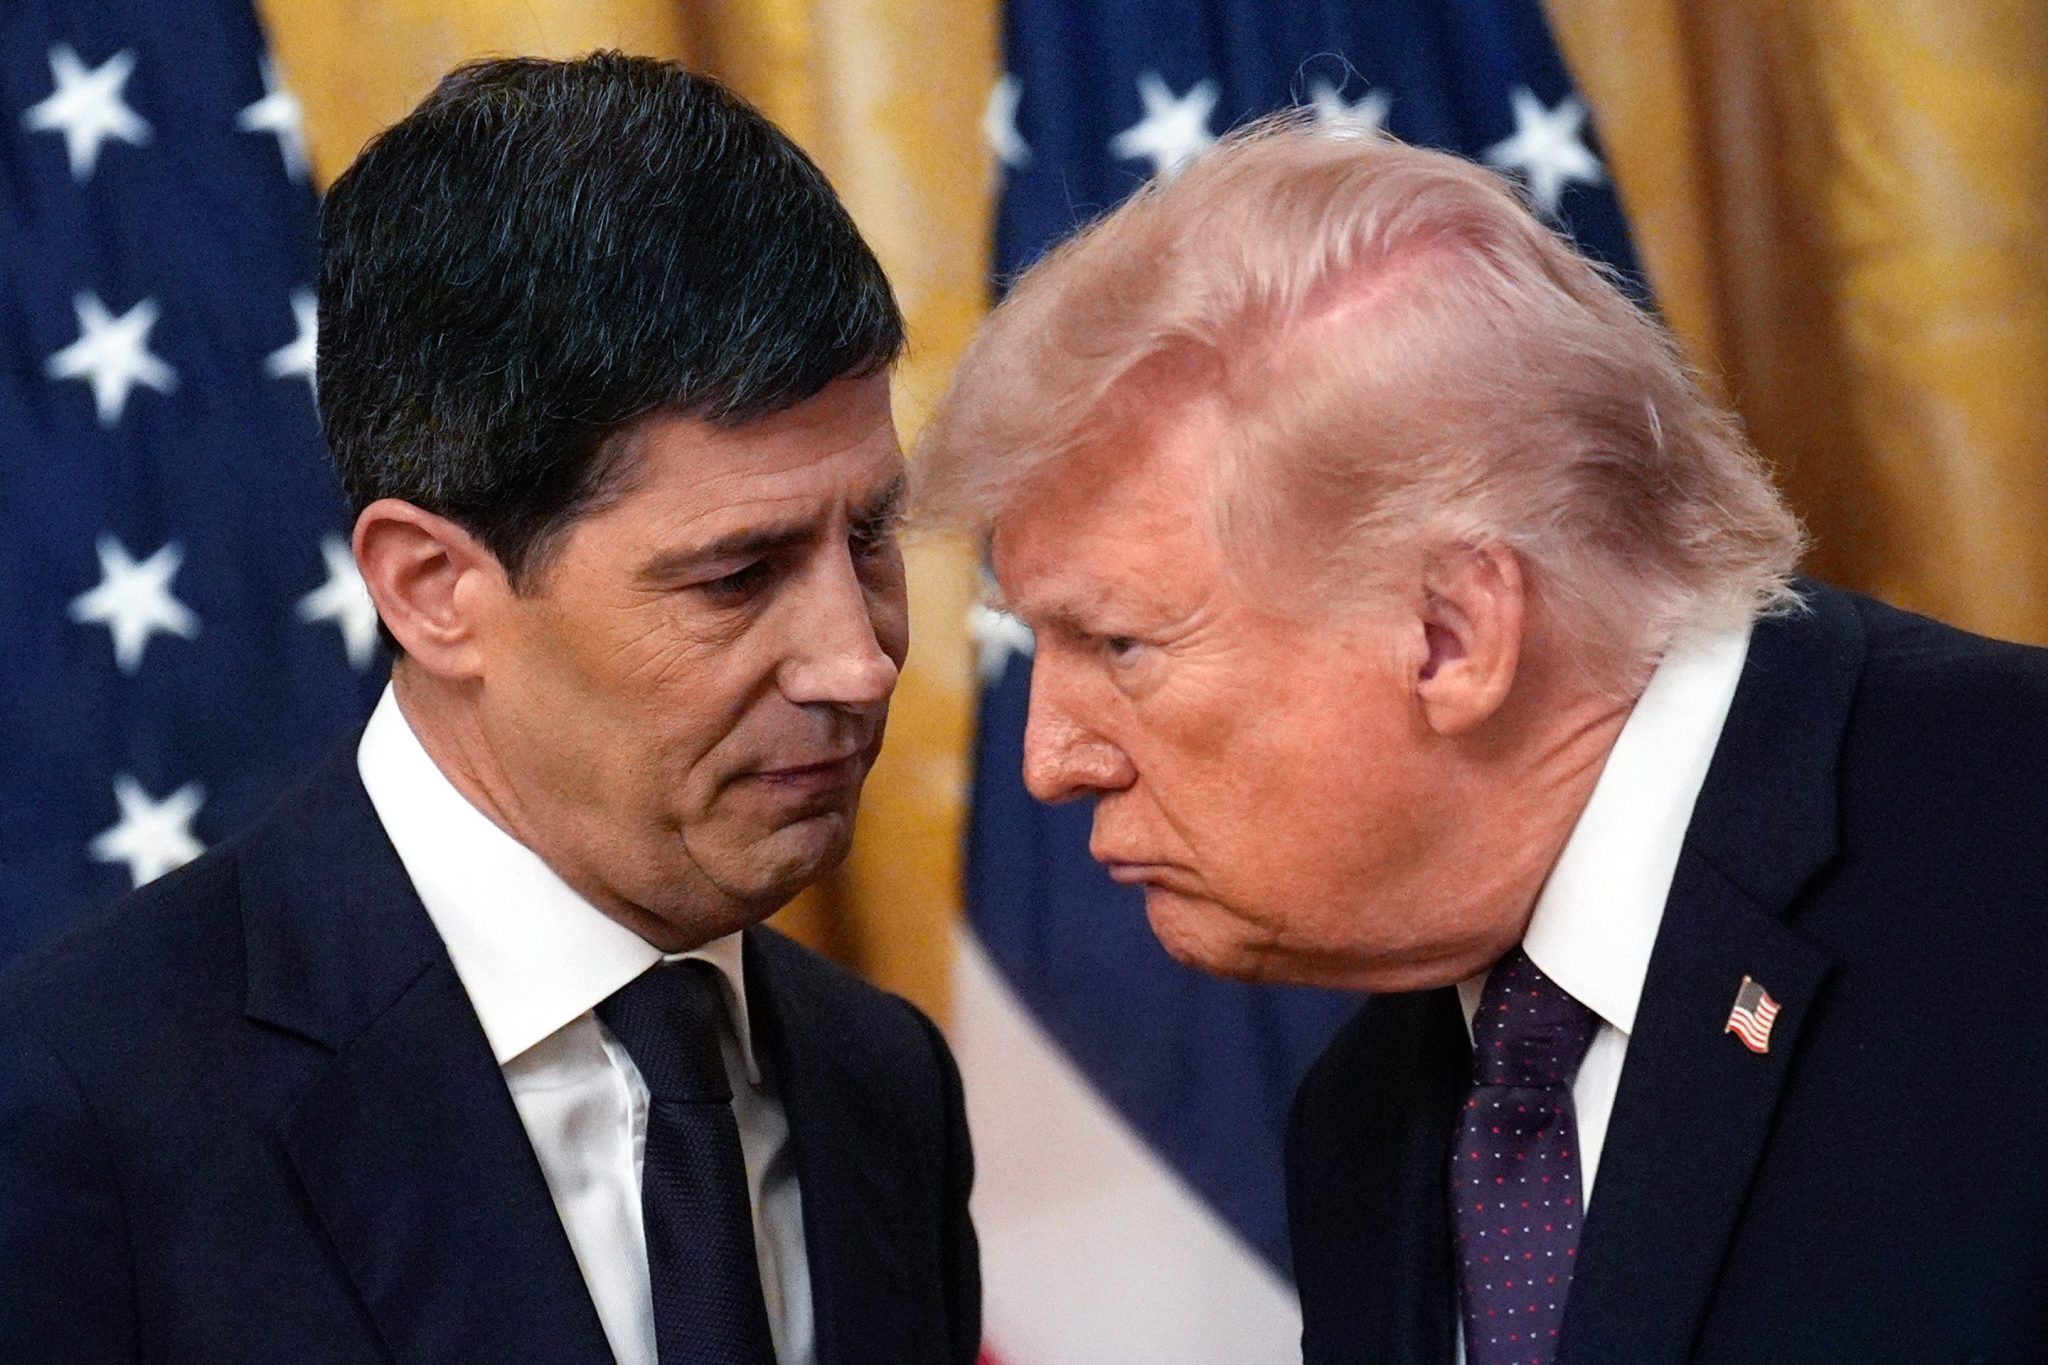
The S&P 500 fell 1% and the Dow lost 1.7% as the Fed chair said rates weren't restrictive before Wednesday's hike.

A 25 bp hike from the BoJ is priced-in for the upcoming rate decision, so perhaps the bigger question is what else the BoJ might have in store. In Scott Bessent's comments a week ago he seemed to insinuate that the BoJ would have something more to say, and that sent USD/JPY down for a test of the lows at the time but sellers couldn't run with a break. Since then, there's been a continued build of higher-lows and after initial resistance at 155.00, bulls used that spot for support around the start of yesterday's rate decision from the Fed. At this point, holding longs can be daunting above the 160.00 level that was sold hard two weeks ago, but unless something shifts or changes, there could still be motive for bulls to bid dips. Motivation for the BoJ should be high as oil prices combined with Yen weakness and surging Japanese yields make for a difficult backdrop given Japan's debt to GDP ratio of more than 200%. - JS

The Fed Hiked. So Why Didn't Gold Stay Down? The Federal Reserve raised its policy rate by 25 basis points to 3.75%–4.00% on September 16, as the chart shows. Gold initially sold off sharply as higher rates, a stronger dollar and higher yields weighed on the non-yielding metal. But the pressure did not last. The key reason: the markets that transmit the Fed's policy signal into gold began moving the other way. The rate hike itself was largely anticipated Because an August inflation report came in hot at 3.4% and energy costs have been surging due to the U.S.-Iran war, investors and traders had already priced in a 90%+ probability of this hike. As a result, the execution didn't shock Wall Street, and major stock indexes initially held relatively flat before pulling back slightly due to the Fed's ongoing hawkish tone, so the announcement did not create a completely new shock to expectations. The more important question became what happened to the U.S. dollar, Treasury yields and inflation expectations afterward. By September 17, the dollar had weakened from its post-Fed high and the 10-year Treasury yield had fallen. At the same time, oil prices declined, reducing some of the immediate inflation pressure that had supported higher yields. Gold subsequently rebounded more than 2% from its post-Fed low. This is why the initial selloff failed to sustain: Fed hike → dollar/yields rise → gold sells off then: dollar/yields retreat + oil falls → pressure on gold eases → gold recovers. The Fed therefore did not become irrelevant to gold. The market simply stopped reinforcing the initial bearish transmission. A rate hike alone is not a complete gold thesis. Watch the U.S. dollar and real Treasury yields alongside the Fed decision. If they continue rising, the rate-hike pressure on gold can persist. If they reverse, gold can recover even with the Fed maintaining a tighter policy stance. The headline was the catalyst. The cross-market reaction determined whether the move lasted.

Given the magnitude and importance of the central bank events taking place this week, FX traders could be forgiven for struggling to sleep at night as they process the possible permutations of what key interest rate decisions from the Federal Reserve (Fed) and the Bank of Japan (BoJ), alongside any comments provided by Fed Chair Kevin Warsh and BoJ Governor Kazuo Ueda on inflation, rising bond yields and future rate moves could mean for the direction of USDJPY into the Friday close. After a sharp sell off from 160 at the end of August down to a low of 152.89 (September 8th), perhaps unsurprisingly, USDJPY prices squeezed back above 155.00 again yesterday as traders squared weak shorts ahead of last night’s Fed decision. Then on hearing the US central bank had decided to hike interest rates 25 bps (0.25%) for the first time in 2026 and indicated they could be prepared to move again before the end of the year, USDJPY prices squeezed all the way up to a high of 156.42 before drifting back to trade at current levels around 155.95 (0630 BST). Now, looking forward, traders have that nervous 24 hour wait to hear the outcome of tomorrow’s BoJ rate meeting (0400 BST). Expectations are for the BoJ to raise rates again, but after last night’s update from the Fed, traders may be looking for something extra from Governor Ueda to reignite the recent USDJPY downtrend or risk a nasty squeeze back up to test higher resistance levels. Technical Update: USDJPY – Normal Pullback or More Sustained Rally? In our USDJPY update on September 7th, we highlighted the formation of a potential Head and Shoulders top, with closing breaks below the neckline support possibly leading to further price weakness (see our commentary timeline for full details). https://www.tradingview.com/x/U99HyXAU/ As can be seen in the daily chart above, subsequent price action has seen the neckline support broken to the downside on a closing basis, and while not a guarantee of extended weakness, this move suggests the potential for a negative shift in USDJPY sentiment. However, as also shown in the chart, price action this week has seen a recovery develop, bringing USDJPY back above the neckline of the reversal. It’s common in technical analysis to see a rally or pullback after completion of a Head and Shoulders top, before fresh declines materialise. However, after this week’s rally, traders may be wondering if last night’s Fed announcement and subsequent price strength, could be ending the threat of the reversal pattern, or if it’s just a limited rally within a developing downtrend, before fresh price weakness is seen again. Ahead of tomorrow’s Bank of Japan rate decision, reassessing the technical backdrop and identifying some key support and resistance levels to monitor may prove useful in establishing the next directional themes for USDJPY. If this is a Normal Limited Pullback to the Reversal: If the latest price strength is to prove a normal pullback to the Head and Shoulders top before fresh price declines are seen, USDJPY upside may be limited, shifting focus to lower support levels. The first key support to focus on may be 154.66 (half of the latest recovery). Closing breaks below this level could suggest the latest price strength is a limited move higher, before fresh USDJPY price weakness and tests of longer‑term support levels are seen again. https://www.tradingview.com/x/qFh75n7f/ As the weekly chart above indicates, closes below 154.66 could lead to further downside momentum, opening potential to test 152.89 (September monthly low), then 151.96 (50% retracement of April 2025 to July 2026 strength), and possibly even 149.12 (61.8% retracement). If a More Extended Price Recovery is to Develop: It is equally possible following last night’s Fed announcement that a more extended USDJPY recovery could materialise. If this is the case, current price strength could challenge the first potential resistance level at 156.62 (50% retracement of September weakness). https://www.tradingview.com/x/c5MLMTUu/ Closing breaks above 156.62 could question the validity of the Head and Shoulders reversal pattern and indicate risks of moves toward higher resistance levels. This could open the way for tests of 157.50 (61.8% retracement) and, if closing breaks above this level are seen, on toward 160.39 (September 2nd high). The material provided here has not been prepared accordance with legal requirements designed to promote the independence of investment research and as such is considered to be a marketing communication. Whilst it is not subject to any prohibition on dealing ahead of the dissemination of investment research, we will not seek to take any advantage before providing it to our clients. Pepperstone doesn’t represent that the material provided here is accurate, current or complete, and therefore shouldn’t be relied upon as such. The information, whether from a third party or not, isn’t to be considered as a recommendation; or an offer to buy or sell; or the solicitation of an offer to buy or sell any security, financial product or instrument; or to participate in any particular trading strategy. It does not take into account readers’ financial situation or investment objectives. We advise any readers of this content to seek their own advice. Without the approval of Pepperstone, reproduction or redistribution of this information isn’t permitted.
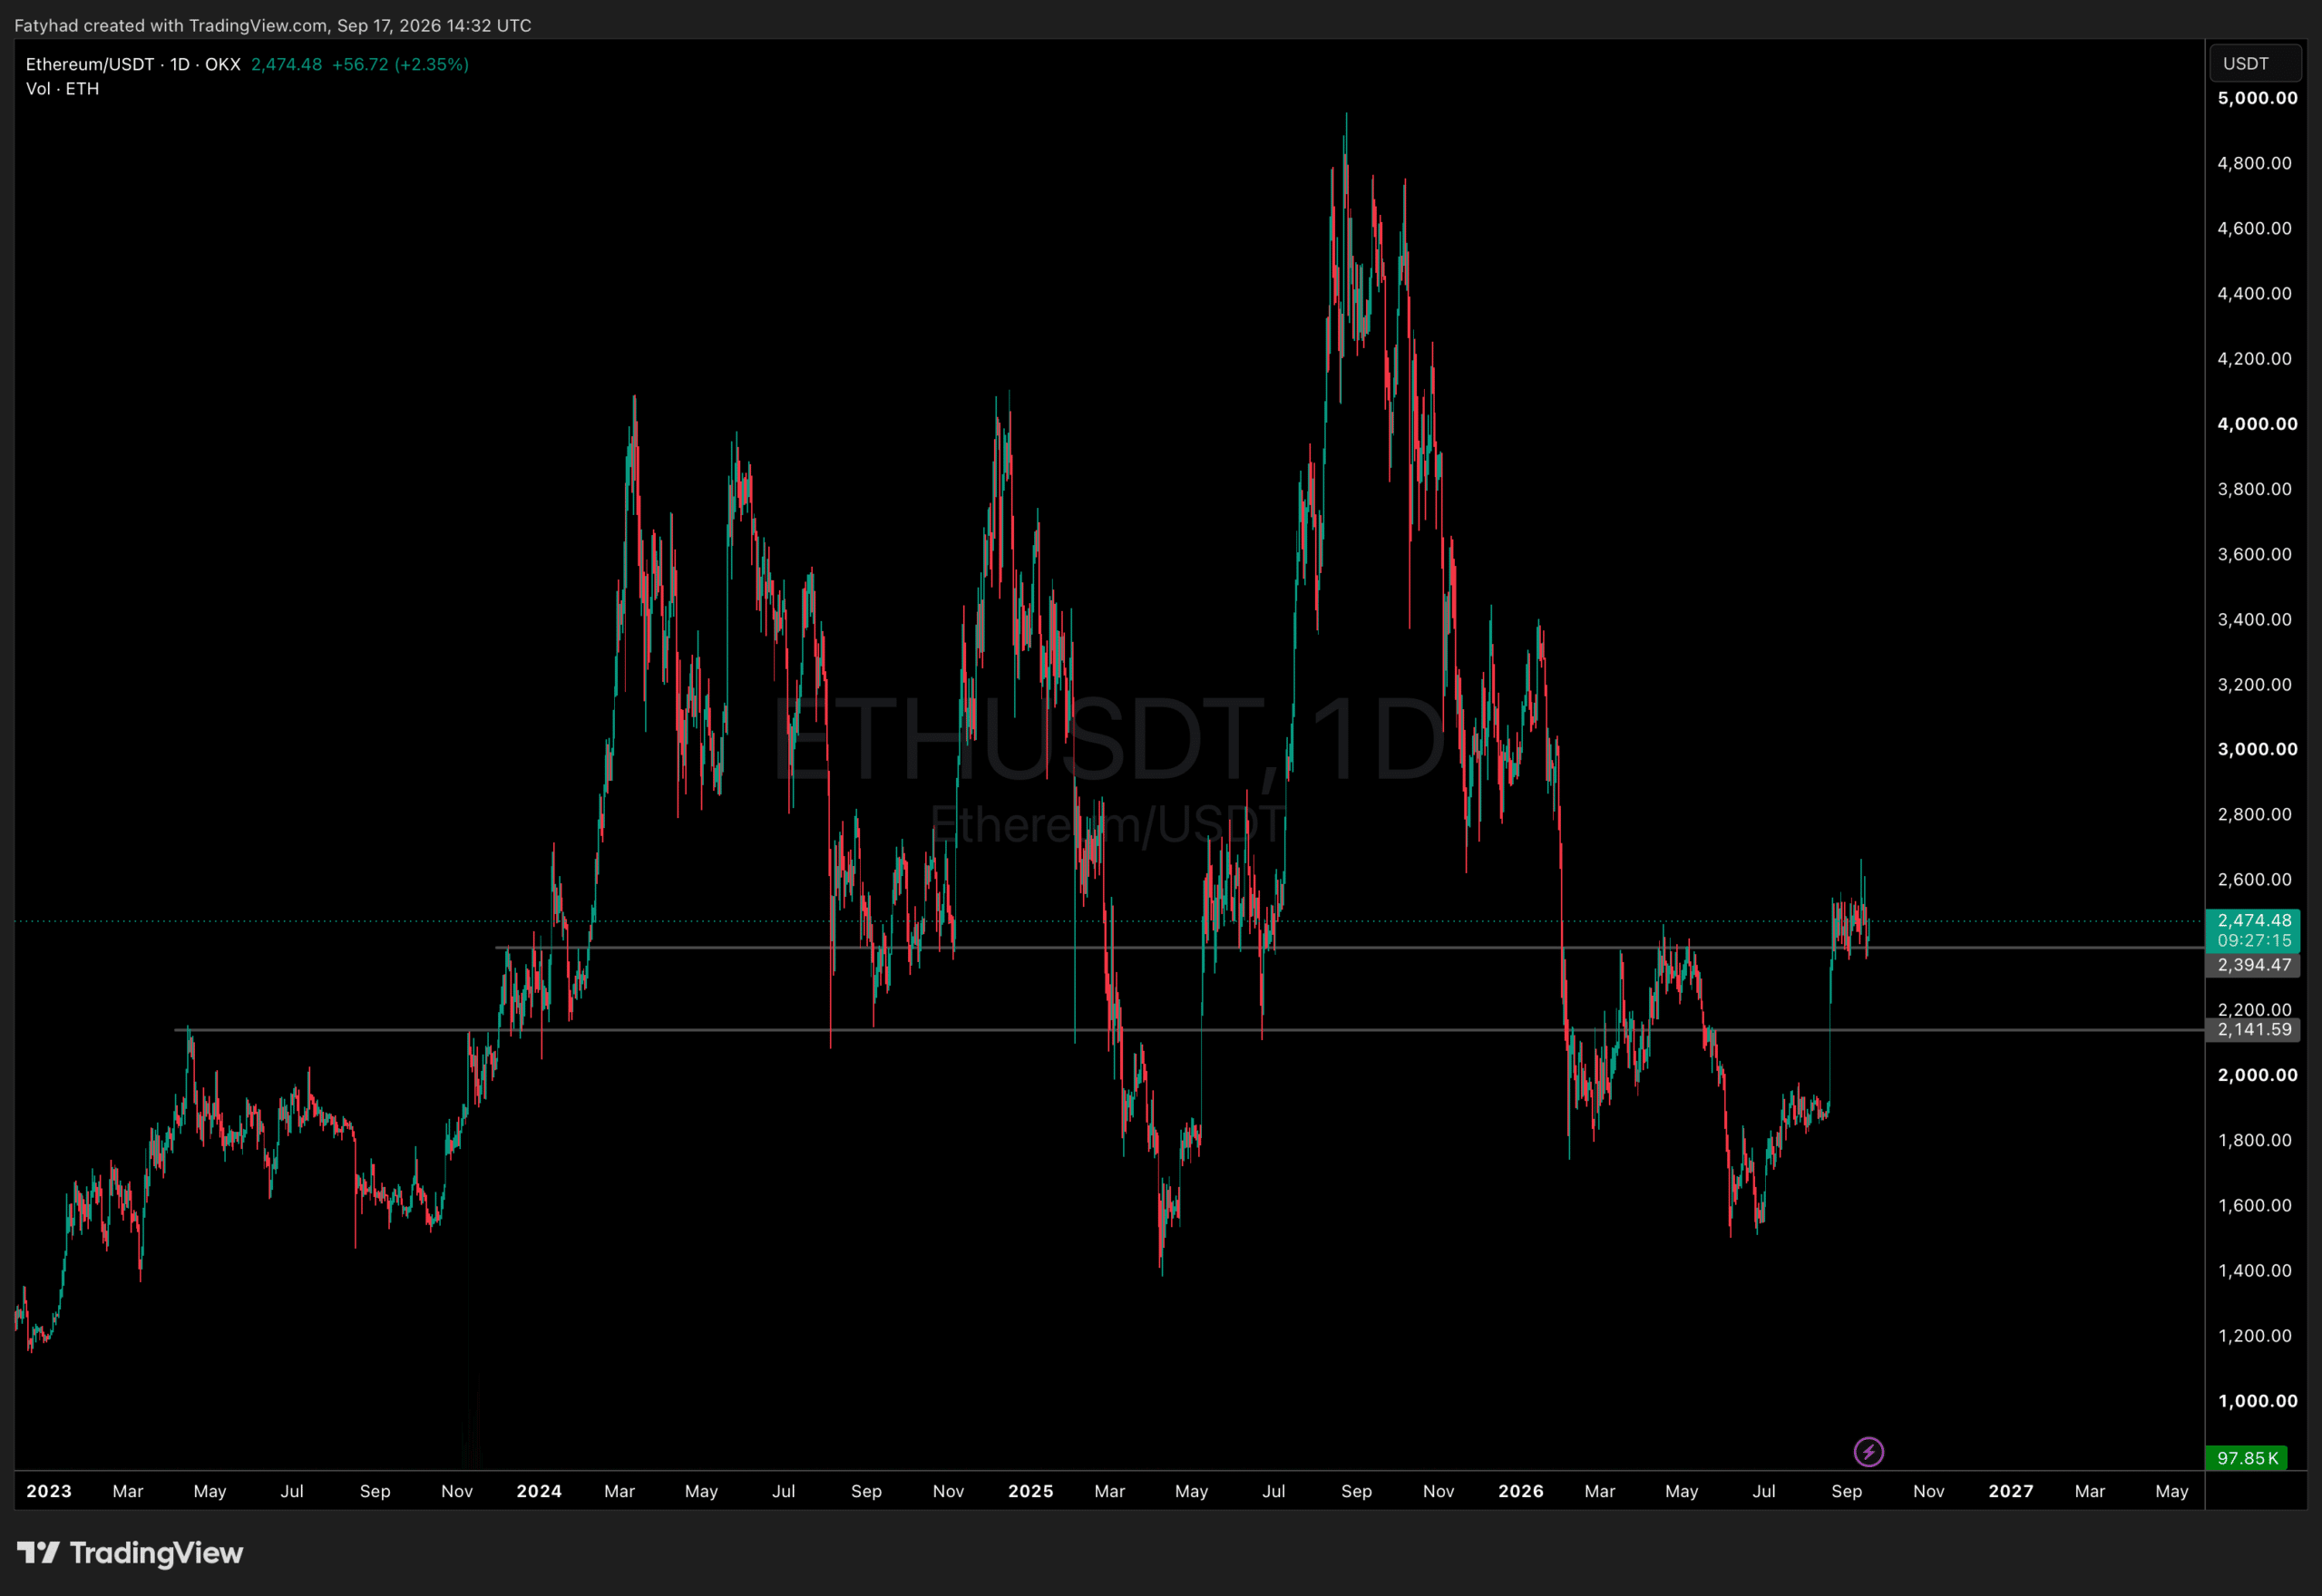
ETH price analysis shows crypto traders adding exposure while US spot ETFs see outflows after the Fed hike and CLARITY Act setback.
 Coinspeaker•Daniel Francis17 Sept
U.S. bitcoin and ether ETFs lost a combined $520.09 million on Wednesday as the Federal Reserve delivered its first interest-rate increase since 2023. XRP, solana and HYPE funds bucked the pressure with modest inflows. Blackrock Leads Bitcoin, Ether ETF Selloff Wall Street’s renewed fight against inflation landed squarely on the crypto market on Wednesday, Sept. […]
 Bitcoin.com News•Emmanuel Musa17 Sept
The pound has once again failed to hold above the key 1.36 area. This time, the pressure coincided with a divergence in central bank policy: the Fed raised rates to 4%, while the Bank of England kept its rate unchanged at 3.75%, shifting the interest-rate differential back in favor of the U.S. dollar. The focus now turns to 1.342. If buyers fail to push the price back above this level, the broad 1.315–1.36 range, where GBPUSD has been trading for an extended period, comes back into focus.
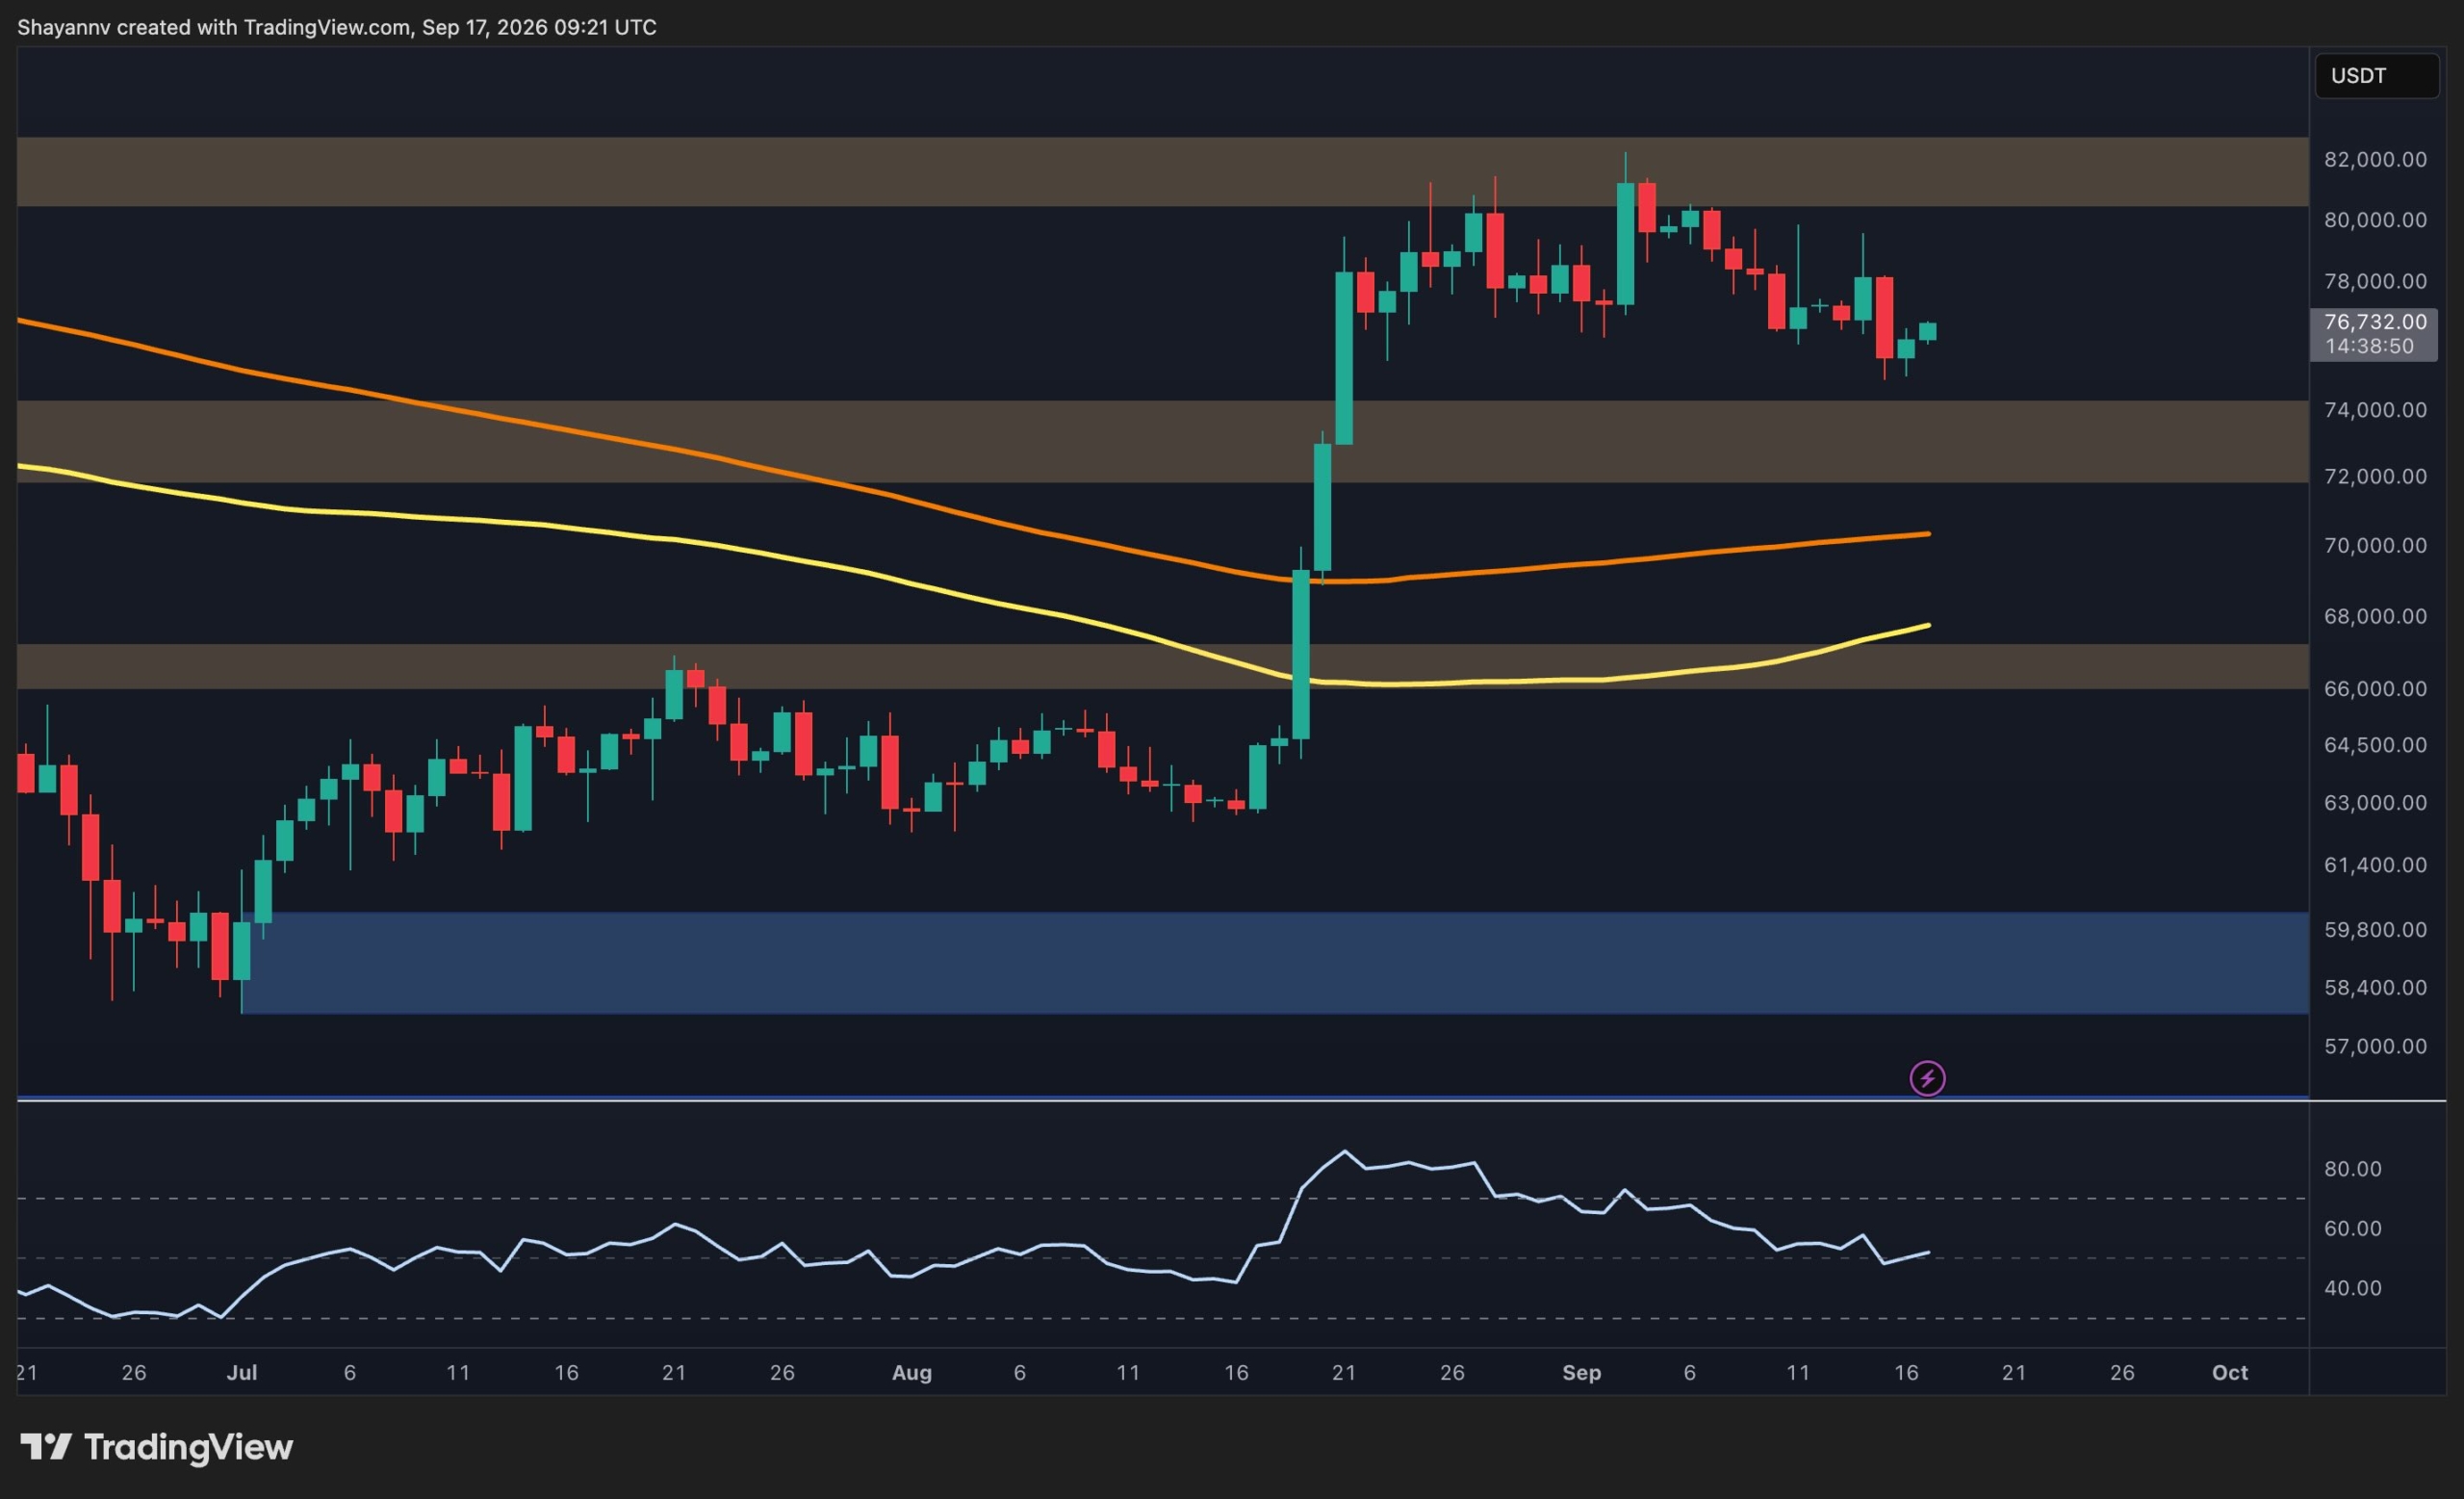
Bitcoin has absorbed a fresh macro shock without losing its broader post-breakout structure. The Federal Reserve raised its target rate by 25 basis points to 4.00% on Wednesday, a tightening move that also strengthened the dollar and pushed Treasury yields higher. Despite this traditionally challenging backdrop for risk assets, BTC continues to trade around $76.7K, […]

The US Federal Reserve has raised interest rates for the first time since 2023, citing stubborn inflation despite pressure from President Donald Trump to cut borrowing costs. The decision prompted an immediate rebuke from Trump, while Fed Chair Kevin Warsh defended the central bank's independence and warned that inflation remains the priority.

Bitcoin trades near $76,484 after the CLARITY Act's cloture failure and a Fed rate hike. Key support, resistance levels, and next catalysts to watch.
Coinspeaker•Daniel Francis17 Sept
The Bitcoin Bull Score Index fell into bearish territory with a score of under 40 after the Fed's hawkish move on Wednesday.
 AMBCrypto•Akashnath S17 Sept
This knocked down the cheap liquidity thesis that supported AI stocks. The double top/rejection near 7,700 shows this. The September volume indicates distribution. The stock market is finally aligning with the credit market, which was already warning via Oracle's CDS and spreads. The important support is 7,570. If lost, the 7,100 target becomes plausible. The day 09/18 is critical: record options expiration ($6.2 trillion) removes the market's buffer, and the Bank of Japan may raise rates, accelerating the unwind of the yen carry trade. Recession risk: the Fed may be tightening on top of an already slowing economy. Employment and housing data may be revised downward, as in 2008. The market is starting to price in this delay. The chart suggests that AI euphoria is being replaced by the reality of high rates, and the drop to 7,100 may materialize if the 7,570 support breaks after the 09/18 events.

Market volatility persists as higher rates pressure corporate earnings and refinancing costs, while geopolitical tensions fuel inflation risks.
CryptoBriefing•Editorial Team17 Sept