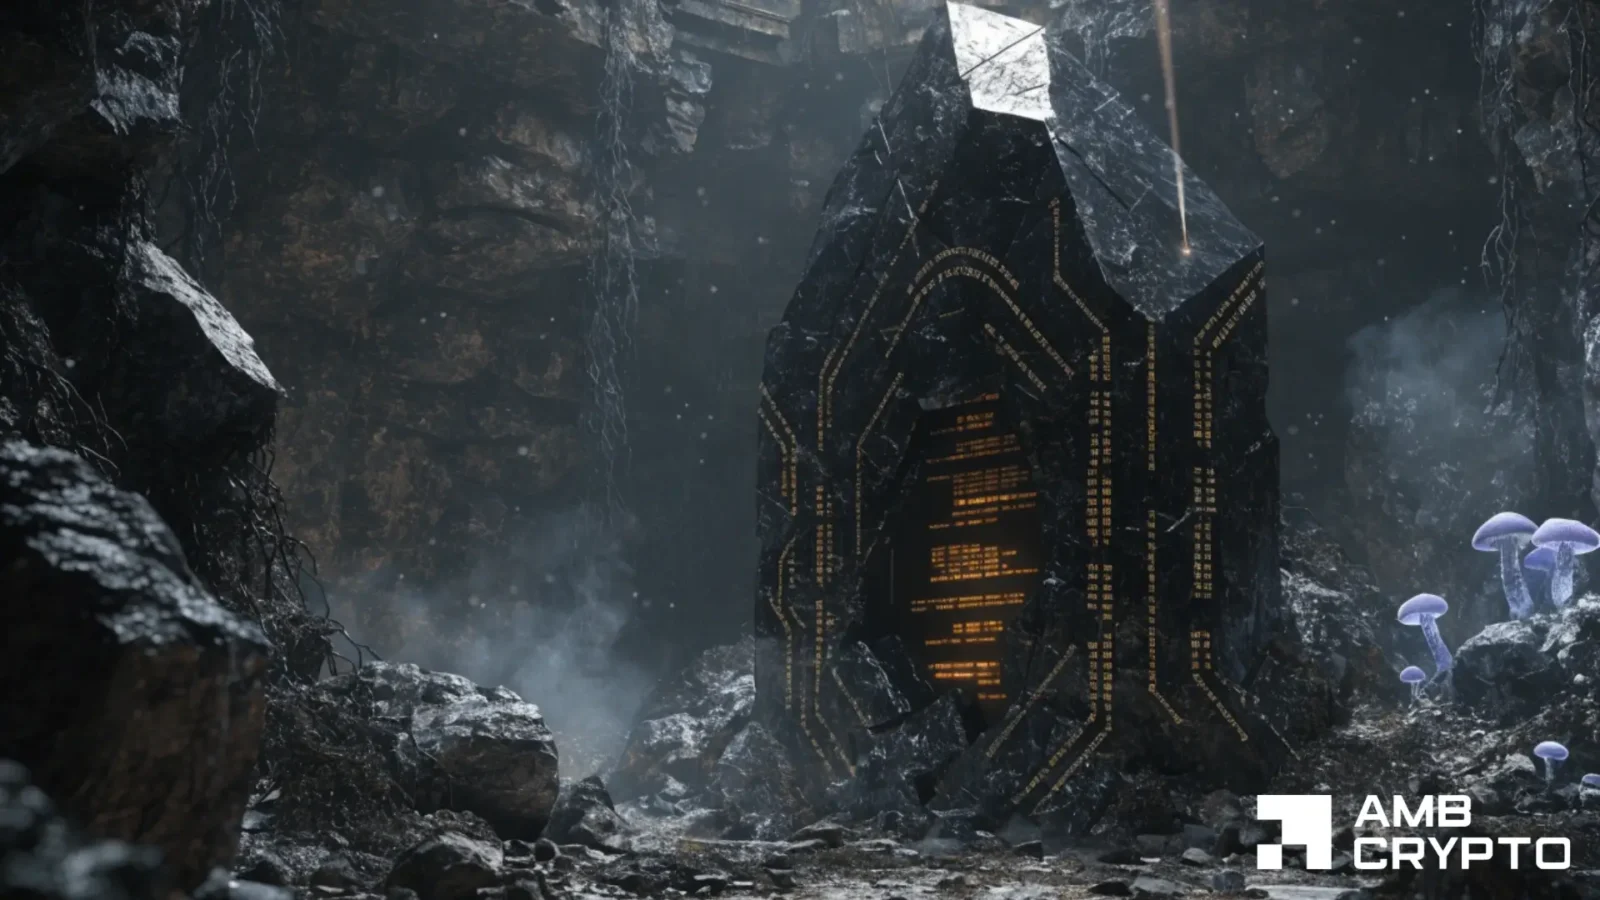
Bitcoin’s first rate hike since 2023 may be only the beginning – Can BTC recover?
The Bitcoin Bull Score Index fell into bearish territory with a score of under 40 after the Fed's hawkish move on Wednesday.
 AMBCrypto•Akashnath S17 Sept
The Bitcoin Bull Score Index fell into bearish territory with a score of under 40 after the Fed's hawkish move on Wednesday.
AMBCrypto•Akashnath S17 Sept
This knocked down the cheap liquidity thesis that supported AI stocks. The double top/rejection near 7,700 shows this. The September volume indicates distribution. The stock market is finally aligning with the credit market, which was already warning via Oracle's CDS and spreads. The important support is 7,570. If lost, the 7,100 target becomes plausible. The day 09/18 is critical: record options expiration ($6.2 trillion) removes the market's buffer, and the Bank of Japan may raise rates, accelerating the unwind of the yen carry trade. Recession risk: the Fed may be tightening on top of an already slowing economy. Employment and housing data may be revised downward, as in 2008. The market is starting to price in this delay. The chart suggests that AI euphoria is being replaced by the reality of high rates, and the drop to 7,100 may materialize if the 7,570 support breaks after the 09/18 events.

Market volatility persists as higher rates pressure corporate earnings and refinancing costs, while geopolitical tensions fuel inflation risks.
 CryptoBriefing•Editorial Team17 Sept
Dudley's critique suggests that insufficient rate hikes could prolong inflation, impacting borrowing costs, market stability, and economic growth.
CryptoBriefing•Editorial Team17 Sept
The new Fed chair has demonstrated that he is committed to upholding central bank independence in the face of pressure

Eased oil prices and Treasury yields may stabilize markets temporarily, but Fed's rate hike hints at potential volatility ahead.
CryptoBriefing•Editorial Team17 Sept
The gold market has once again surprised investors. After the Fed raised its interest rate by 25 basis points to 3.75–4.00% on September 16 , gold did not continue falling. Instead, it reversed higher. On September 17, XAUUSD gained around 1.6% and rose toward $4,330 per ounce , even though prices had fallen to approximately six-week lows just the day before. At first glance, this reaction may seem illogical: higher interest rates usually strengthen the dollar and reduce gold’s appeal. But this time, the market reacted differently — and that is the key to understanding the current move. Why Is Gold Rising Despite Higher Rates? The rate hike had already been priced in . The Fed’s decision itself did not come as a surprise to the market. Therefore, after the announcement, some market participants began closing their previous short positions in gold. Investors are focused not on the hike itself, but on what comes next . The Fed has indeed maintained a hawkish tone and left the door open to another rate hike before the end of the year. However, the market has already started assessing how far the regulator can actually go if the economy begins to slow down. The oil rally has paused . Reduced pressure from oil prices has somewhat eased concerns about another wave of inflation. This is important for gold because it lowers the risk of even more aggressive Fed tightening. Demand for safe-haven assets remains strong . Despite the rate hike, geopolitical tensions in the Middle East and overall nervousness in global markets have not disappeared. This continues to support interest in gold as a safe-haven asset. For the market, it is now important not only to consider the current interest-rate level, but also how quickly the Fed can continue tightening without causing serious damage to the economy and stock market. This is why gold has an opportunity to recover: investors have seen that a hawkish Fed decision does not necessarily mean an automatic continuation of the XAUUSD sell-off. According to FreshForex analysts, the current gold recovery shows that the market is still willing to buy XAUUSD dips when signs of stabilization emerge . If prices hold above the $4,300 area, buyers may attempt to extend the move toward $4,400–4,500 .

Stocks are set for a big bounce-back rally after yesterday's Fed sell-off.
Warsh's flexible approach may stabilize markets by avoiding a full rate hike cycle, but uncertainty could still pressure interest-sensitive sectors.
CryptoBriefing•Editorial Team17 Sept
The uncertainty in Fed rate hikes highlights the tension between market expectations and historical policy patterns, impacting economic forecasts.
CryptoBriefing•Estefano Gomez17 Sept
Warsh's rate hike underscores the Fed's commitment to data-driven policy, potentially straining political relations and impacting market dynamics.
CryptoBriefing•Editorial Team17 Sept
Fundamental Analysis Gold is recovering after the Fed raised rates 25 bp to 3.75%–4.00%. A softer U.S. dollar and easing oil prices are supporting the rebound, although the Fed’s signal that further hikes may still come keeps the broader macro backdrop cautious for Gold. Technical Analysis On H1, Gold has recovered strongly from the 4,250–4,260 support area and pushed through the 4,350–4,360 OB Sell Zone. Price is now near 4,373, showing improving bullish momentum. A short pullback toward the 4,305–4,328 FVG High Zone may provide a cleaner continuation area if buyers remain in control. The main upside objective is the 4,390–4,405 Major Resistance / BSL. Important Key Levels 4,390–4,405 — Major Resistance / BSL 4,350–4,360 — OB Sell Zone 4,305–4,328 — FVG High Zone 4,235–4,245 — OB Buy Zone + Support Trading Scenario Buy priority remains on a controlled pullback followed by bullish H1 confirmation. Target: 4,390–4,405 BSL. Invalidation: H1 acceptance below the FVG High Zone. Overall View Short-term momentum has shifted bullish, but chasing the current expansion is less attractive. A pullback into support could offer a cleaner continuation setup toward upper liquidity. Will Gold retest the FVG first, or continue directly toward 4,400?

I'm guessing we are about to check what is going to happen today with the response to the response of the announcements of the Fed. Um, so far it's been pretty quiet. There was a drop in the end of the day yesterday, but as you can tell by the chart, it uh, had like a bouncy ball style response of this shape recovery pretty fast and it uh, keeps going up and uh, I think following the DAX there is the same amount of activity that was at higher highs. Um, it was in the range but now it broke and so the NQ as well. I'm assuming the ES is following suit. But the market breadth doesn't look so great, although there are a lot of few um, leading stocks that are being active. NYSE:DELL NASDAQ:MRNA NASDAQ:WULF NASDAQ:MU NASDAQ:AMD

A robust labor market complicates Fed rate cuts, supporting the US dollar but potentially compressing growth-sensitive asset valuations.
CryptoBriefing•Editorial Team17 Sept
NASDAQ:NVDA FOMC is done, but for me the real trade starts with the reaction. The Fed raised rates by 25bps to 3.75%–4.00%, and now I’m watching which stocks can actually hold their levels. NASDAQ:NVDA is the one I’m focusing on. 📊 My NVDA setup NVDA is trading around $213.89 on the 4H chart after getting rejected from the 232–234 area. The level I care about now is 216–220. If price reclaims 220 and holds above it, I’m watching 228 first, then 232–234. That would give me a clear breakout structure instead of chasing candles. If 220 keeps rejecting, I’m not forcing an entry. The next area I’m watching is 208–210, with 200 as the major support. My invalidation is simple: if the 208–210 support zone breaks with confirmation, the bullish setup loses strength. ⚠️ The risk The biggest mistake here would be assuming that FOMC being over automatically means stocks should move higher. The market still has to confirm it. That’s why I marked the zones instead of trying to predict every candle. I want price to come to my levels and show me what it wants to do. 🎯 Why Bitget for this setup? This is also why I like trading the setup through Bitget. NVDA Stock Perps are available 24/7, so I’m not limited to traditional U.S. market hours. I can use USDT, go long or short, and manage the position even when Nasdaq is closed. Bitget also puts Stocks, CFDs and Crypto on the same platform. For a trader who watches both traditional markets and crypto, that makes switching between markets much easier. Liquidity is another big reason. The current Bitget’s market-depth position for U.S. Stock Perps against Binance, OKX, Bybit and Hyperliquid. For a setup like NVDA, where execution matters around key levels, I’d rather trade where there is strong order-book depth and less concern about unnecessary slippage. Bitget also supports standard futures-style tools like limit, market, trigger, TP and SL orders, while stock futures remain available 24/7. 📌 Final plan Above 220 → 228 → 232–234 Below 208–210 → 200 Between those levels → wait. I’m adding this setup to my KCGI TradingView journal. No forced trade. I’ll let NVDA confirm the direction first.

The Fed's rate hikes may inadvertently strain other economic sectors while failing to address the structural supply issues in memory chips.
CryptoBriefing•Editorial Team17 Sept
Washington’s stablecoin debate is about characteristics: who can issue one, what has to back it, and how it gets audited. The Federal Reserve, the US central bank, and the OCC, the regulator that supervises the country’s national banks, cannot simply accept that a token is worth one dollar; they have to control who is allowed
 BeInCrypto•Julián Colombo17 Sept
The Clarity Act failed to pass and FOMC hiked rates, and yet, crypto majors are green and alt leaders are flying. What does it mean?
The rate hike underscores the Fed's struggle with credibility amid persistent inflation, highlighting potential future policy challenges.
CryptoBriefing•Editorial Team17 Sept
JPMorgan CEO Jamie Dimon says it's not clear inflation has been slayed after the Fed's latest rate hike, citing persistent pressures and capital demand.
 The Daily Hodl•Daily Hodl Agent17 Sept