XRP Falling Wedge Breakout? Next Move Target $1.75 and $2.01?
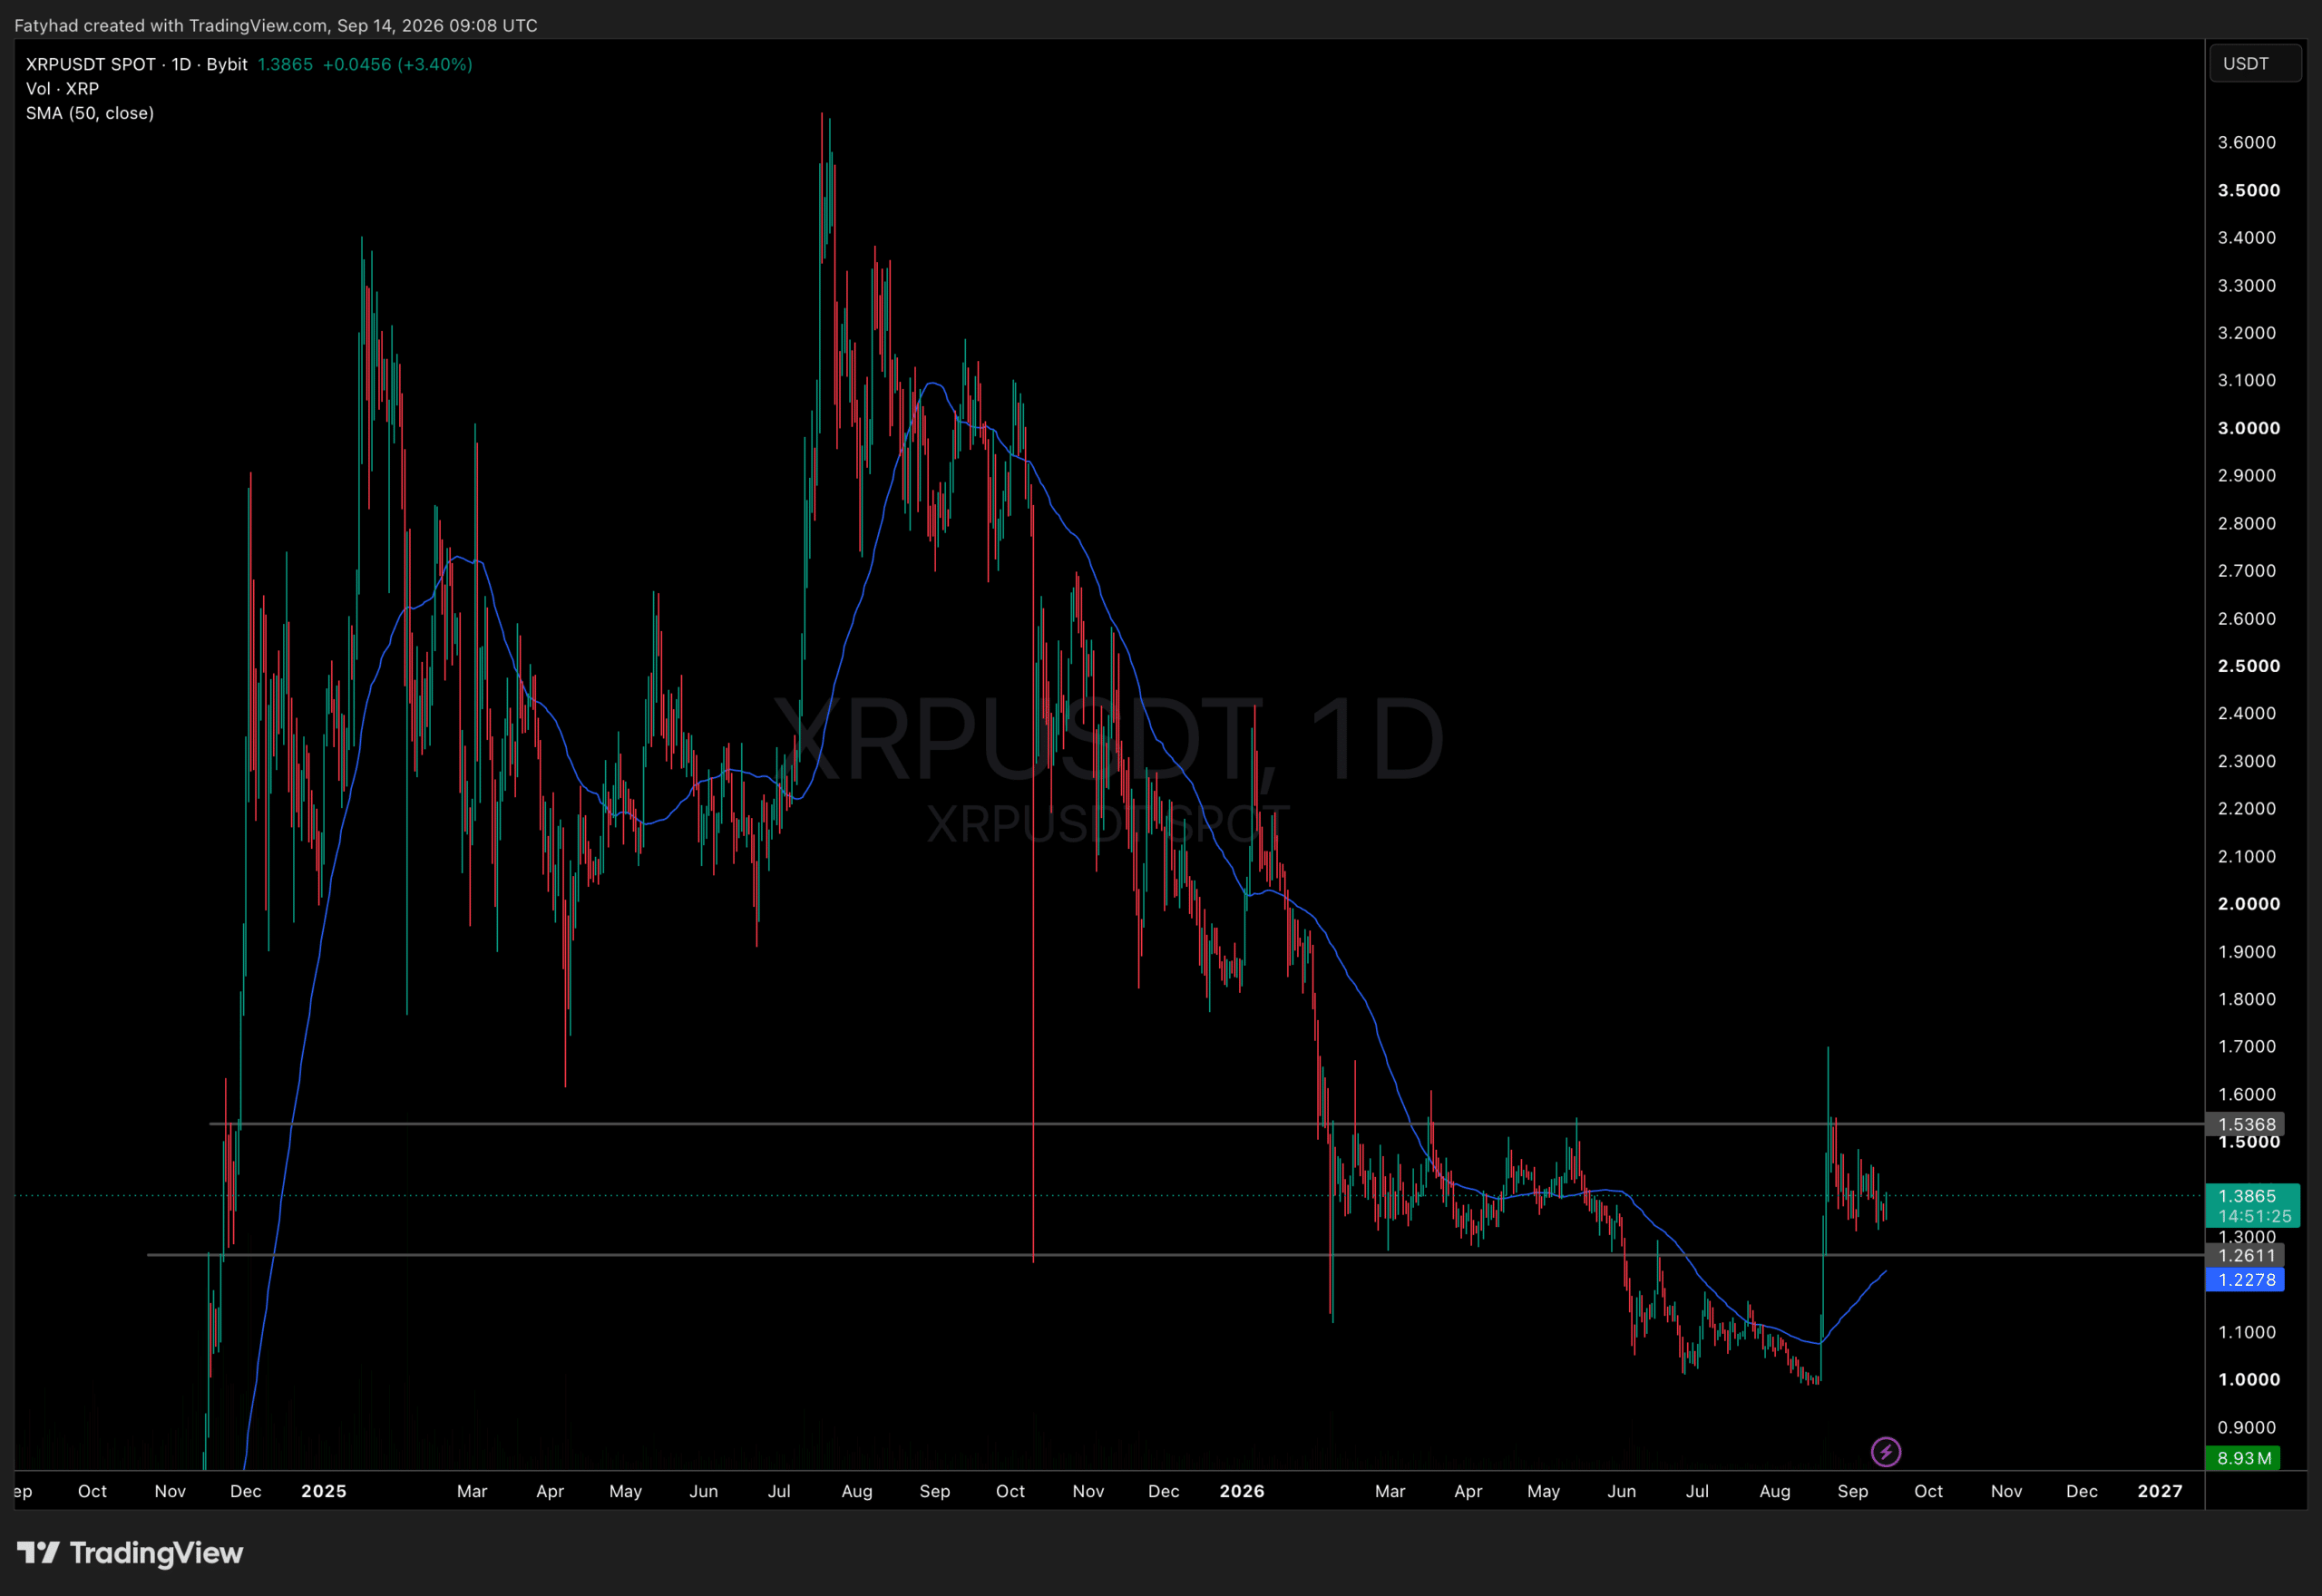
CRYPTOCAP:XRP XRP has spent the recent period consolidating after its strong upside move, with price compressing between a descending resistance line and a rising/less-declining support structure.
The current structure can potentially be interpreted as a falling wedge, but the important point is that XRP has repeatedly pushed toward the upper boundary without yet producing a fully confirmed breakout on the chart.
After the previous impulsive move, this type of consolidation can represent a time-based correction or period of rest rather than an immediate bearish reversal. Price has continued to hold above the broader support structure while sellers have struggled to produce a sustained breakdown.
The latest price action is now pushing through the upper resistance area, making the next reaction particularly important.
Technical Structure
The main structure visible on the chart is a potential falling wedge / contracting consolidation.
Price has:
Established a major upside move before entering consolidation.
Repeatedly tested the descending resistance.
Continued to trade above the major support structure.
Recently pushed above the upper wedge boundary.
Marked a potential pullback/support area around $1.34–$1.40.
The breakout should not automatically be treated as confirmed continuation. A successful retest and hold of the breakout area would provide stronger evidence that resistance has shifted into support.
Setup
Timeframe: Not clearly visible on the provided chart
Current Price: Approximately $1.4577
Bias: Bullish while the marked structure remains valid
Entry / Pullback Zone: $1.34–$1.40
Invalidation: $1.20
Target 1: $1.75
Target 2: $2.01
The chart does not provide a precise entry price. The cleaner approach is:
Wait for a pullback and confirmation in the marked zone.
The $1.34–$1.40 area is important because it is the marked Support Zone (Pullback) and provides a better location to evaluate whether buyers are willing to defend the breakout structure.
Why $1.75?
The $1.75 level is explicitly marked on the chart as the Short-Term Target and corresponds to the 61.8% Fibonacci level shown.
If XRP successfully confirms the breakout and begins a sustained continuation, this is the first major upside objective shown in the setup.
Why $2.01?
The $2.01 level is explicitly marked as the Mid-Term Target and corresponds to the 100% Fibonacci level shown on the chart.
This is therefore the larger continuation objective of the setup, rather than an additional target created independently.
Invalidation The marked $1.20 level is the invalidation level.
A decisive move below this area would significantly weaken the bullish structure and invalidate the current setup. At that point, the falling-wedge breakout thesis would no longer have the same technical basis.
Confirmation
I would wait for one of the following before treating the setup as higher probability:
A strong candle close above the descending resistance.
A pullback toward the $1.34–$1.40 zone.
Rejection from that zone with buyers stepping back in.
A successful retest where former resistance acts as support.
Stronger volume on the breakout, if volume confirms the move.
The key is not simply whether XRP trades above resistance intraday. The quality of the breakout and subsequent retest matters more.
Bullish Scenario
If XRP holds the breakout structure and successfully defends the marked pullback zone, the continuation scenario remains active.
The path shown on the chart is:
Breakout → Pullback/Retest → Confirmation → $1.75 → potentially $2.01
A sustained move toward $1.75 would strengthen the case for the larger mid-term objective at $2.01.
Bearish Scenario
The bullish thesis becomes questionable if XRP fails to hold the breakout and falls back into the wedge.
A deeper breakdown, particularly below the marked $1.20 invalidation, would invalidate the current bullish setup.
This would suggest that the consolidation was not simply a pause before continuation and that sellers have regained control.
Risk Management
The main mistake here would be chasing the breakout after an extended move.
The setup offers a more attractive risk framework if price provides a controlled pullback toward the marked $1.34–$1.40 support zone and then confirms buyer participation.
The $1.20 invalidation should remain clearly defined before taking any position. Position size should be determined from the amount of capital one is willing to risk, not from the potential target.
No technical pattern guarantees continuation. The market still has to confirm the thesis.
Save this chart and follow the next update. The key development to watch is whether XRP can turn the breakout area into support and continue toward the marked targets.
Risk Warning : This is a technical setup, not a guaranteed outcome. Wait for confirmation, respect the invalidation level, and never risk more than you can afford to lose.
TITradingView Ideas14 Sept