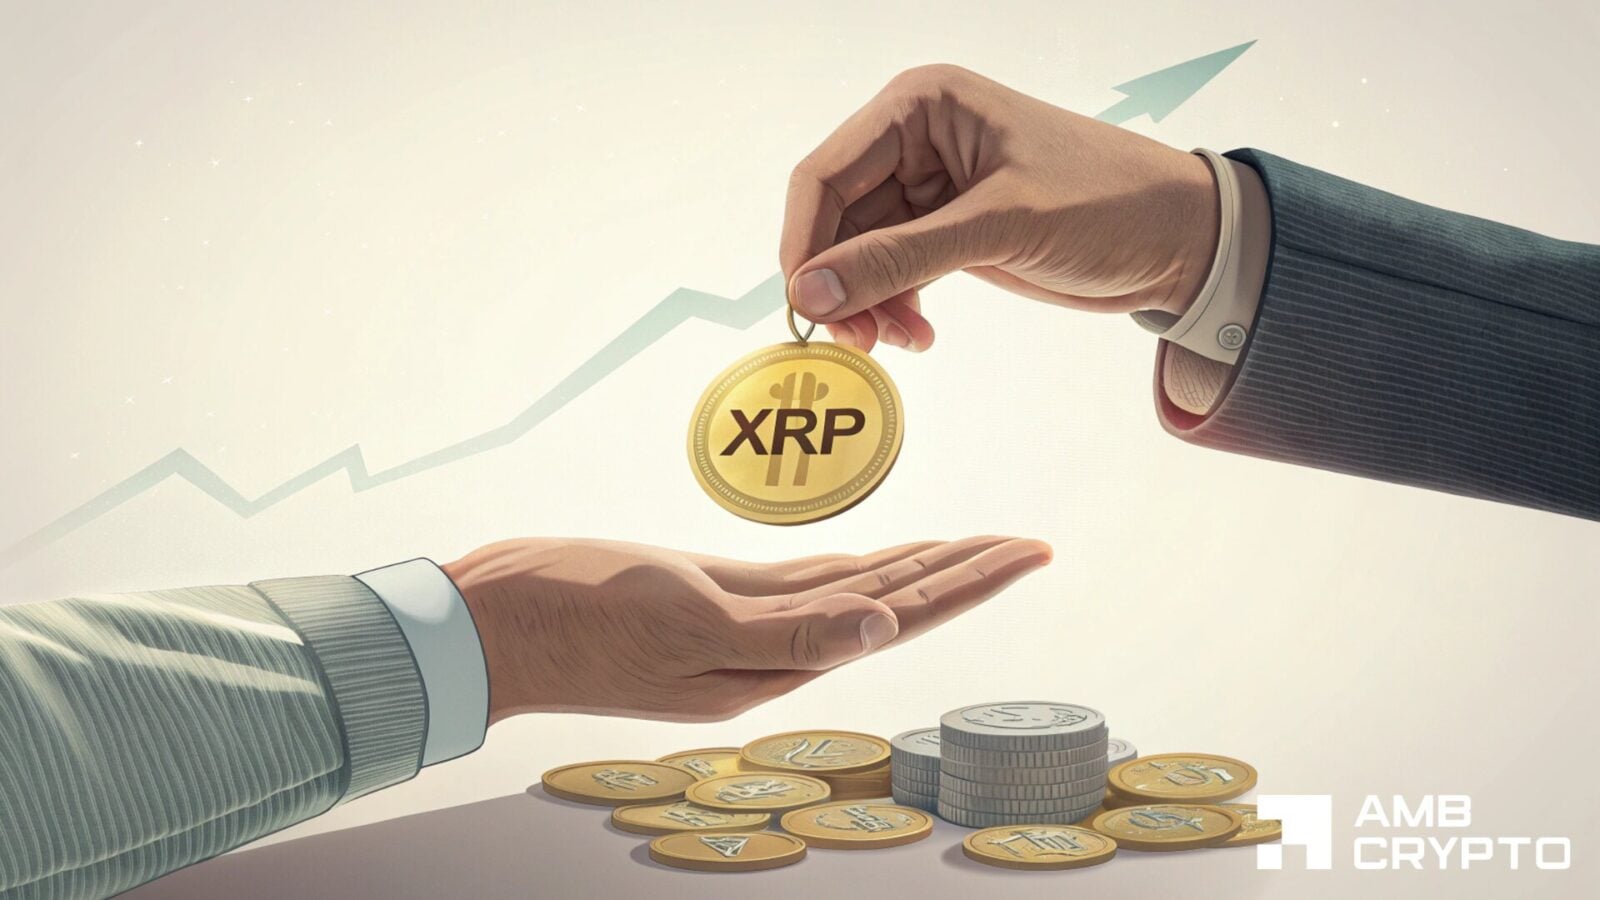
XRP Ledger’s Batch V1.1 is one vote away – Can 8 transactions change XRPL?
Eight transactions, one block: Is XRPL’s batch V1.1 the Q4 catalyst XRP needs?
 AMBCrypto•Ritika Gupta15 Sept
Eight transactions, one block: Is XRPL’s batch V1.1 the Q4 catalyst XRP needs?
AMBCrypto•Ritika Gupta15 Sept
 CoinDesk•Omkar Godbole15 Sept
 CoinDesk•Krisztian Sandor15 Sept
Ripple plans to invest as a limited partner in an institutional credit fund to lend its RLUSD stablecoin to fintech companies for working capital, as Clearpool announced an expansion onto the XRPL (XRP Ledger) in a governance proposal on September 11, 2026.Developed in partnership with Cicada Partners and Hex Trust, this initiative aims to create […]
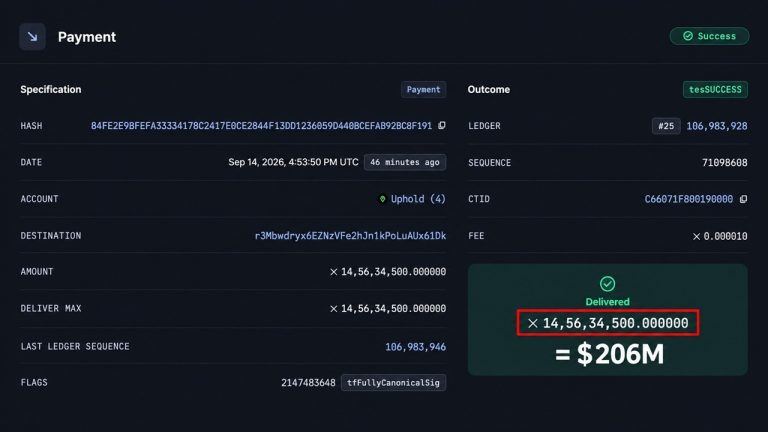
A single 145,634,500 XRP transfer worth about $206 million emptied a labeled Uphold wallet on Sept. 14, but onchain records point to an internal custody reshuffle rather than a whale exit. The Alert That Started It Onchain trackers flagged the move as 145,634,500 XRP (valued at $206,551,114) being sent from one wallet to another within […]
 Bitcoin.com News•Shiraz Jagati15 Sept
XRP price sits near $1.40 as the CLARITY Act vote approaches, with $1.39 support, $1.42 resistance and fading momentum keeping direction uncertain.
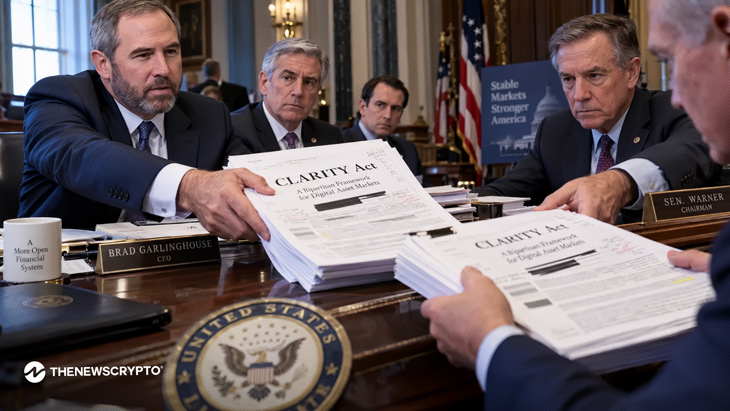
Ripple CEO Brad Garlinghouse defended the crypto CLARITY Act framework ahead of today’s Senate vote, stating that the bipartisan policy trades made to build the bill “weren’t small.” Brad Garlinghouse has thrown his support behind Treasury Secretary Scott Bessent’s latest push for the CLARITY Act, urging the Senate to move
 TheNewsCrypto•Sarala15 Sept
Senate Republicans released a revised CLARITY Act draft hours before the cloture vote. It runs to 635 pages, up from 616, and one of the new pieces defines an ancillary asset in a way that settles XRP’s status in secondary…
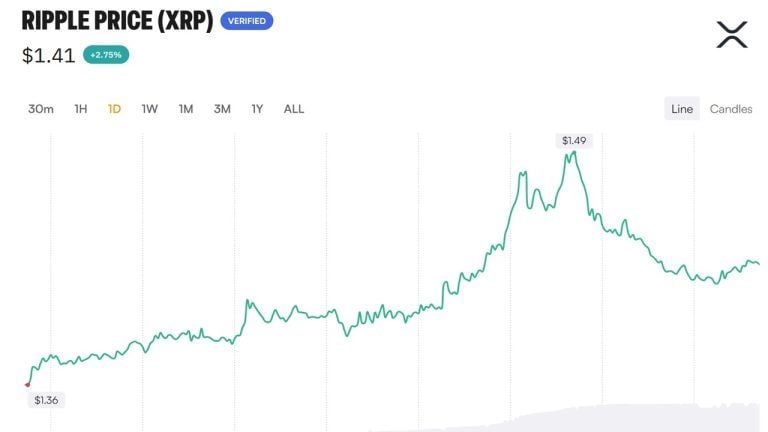
XRP climbed as much as 9.8% in the day ahead of Tuesday’s Senate CLARITY Act cloture vote before cooling to $1.41, as futures traders piled fresh leverage into the move. The Numbers XRP spent Sunday pinned near $1.34, but by Monday afternoon it was floating around $1.49, up 9.8% for the day. Since then, the […]
Bitcoin.com News•Shiraz Jagati15 Sept
XRP trades near $1.40 as one validator vote could trigger XRP Ledger's Batch V1.1 upgrade. Full price analysis, key levels, and catalysts to watch.

The man behind XRP and Ripple, David Schwartz, admits early blockchain mistakes and explains why stablecoin payments remain fundamentally broken in 2026.
 U.Today•Gamza Khanzadaev15 Sept
Institutional lending on XRPL could boost Ripple's ecosystem, potentially enhancing XRP's market position and attracting more institutional users.
 CryptoBriefing•Estefano Gomez15 Sept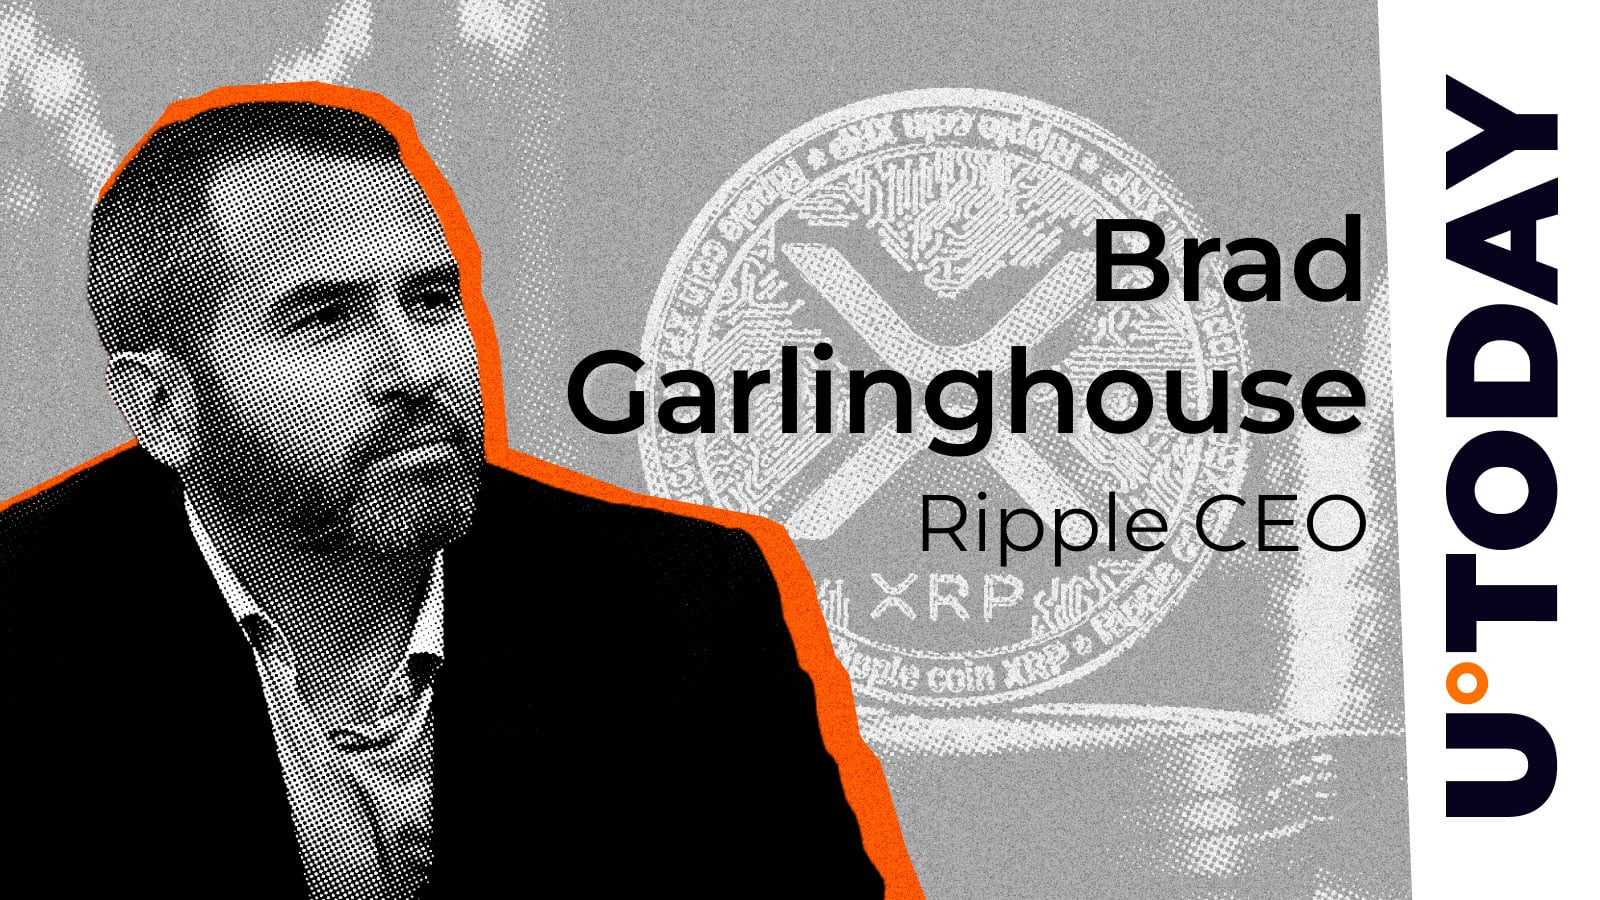
Ripple CEO Brad Garlinghouse is urging senators to back the Clarity Act ahead of a crucial procedural vote.
U.Today•Alex Dovbnya15 Sept
https://www.tradingview.com/x/SbHekzCm/ Sometimes the most important thing in trading is not finding another indicator. BYBIT:XRPUSDT is showing a potentially important development on the monthly chart. After months of trading inside a falling wedge , price is now attempting to break above the upper trendline. At first glance, this looks like a bullish breakout. But there’s one important detail: the monthly candle still has around 15 days left before it closes. Until that candle closes, the breakout is not confirmed. 🕯️ Why the Monthly Close Matters A price moving above a trendline during an active candle and a candle actually closing above that structure are two very different things. During the next 15 days, XRP could continue higher and finish the month above the descending trendline. That would strengthen the case that the previous bearish structure may be changing. But price could also move back below the trendline before the candle closes. That would turn what currently looks like a breakout into a potential failed breakout or rejection . This is exactly why patience matters. Don’t confuse an intramonth move with a confirmed monthly breakout. 📈 Scenario 1: The Breakout Gets Confirmed If XRP manages to maintain its position above the descending trendline and the monthly candle closes convincingly outside the structure, the chart becomes much more interesting from a bullish perspective. The first thing I would watch afterward is not simply whether XRP immediately moves higher. I would watch how price behaves around the broken structure . Does the former resistance begin acting as support? Does XRP hold above the breakout area? Do buyers continue defending higher levels? A successful breakout followed by acceptance above the previous structure could provide further evidence that momentum is shifting. But even then, nothing is guaranteed. 📉 Scenario 2: The Breakout Fails This scenario deserves just as much attention. XRP could spend several days above the trendline and still close the month back inside the descending structure. If that happens, the current move could become a false breakout . That would immediately change the picture. Instead of assuming that every breakout must continue higher, we should already know what would invalidate the bullish scenario. That is the difference between predicting the market and preparing for the market. ⚠️ Confirmation Is Not a Guarantee This is probably the most important point. Even if XRP closes the monthly candle above the trendline in 15 days, a confirmed breakout does not guarantee continuation. Markets do not owe us a successful retest. They do not have to continue in the direction of the breakout. And they certainly do not have to follow the arrows we draw on a chart. A breakout simply gives us new information . From there, we still need to watch price structure, reactions around important levels and whether the market actually accepts the new price area. 🧠 Prepare for Both Outcomes Right now, I don’t think the goal should be to say: “ XRP has broken out, so it has to go higher. ” A better approach is: “ XRP is attempting a potentially important breakout. Now let’s see whether the monthly candle can confirm it .” If it does, we can watch for bullish continuation and how the previous resistance behaves. If it doesn’t, we should already be prepared for price to move back into the previous structure. And even after confirmation, we remain prepared for a failed retest or reversal. That is what scenario planning is about. ⏳ 15 Days to Go The chart is giving us an interesting signal. Now the market needs to prove it. Around 15 days remain until the monthly candle closes. Instead of trying to predict what XRP will do during those 15 days, I’d rather wait and see where the candle actually finishes. Because sometimes the best trading decision is simply to let the candle close . Then reassess. Then build the next scenario. Disclaimer: This analysis is for educational and informational purposes only and does not constitute financial or investment advice. Cryptocurrency markets are highly volatile and involve substantial risk. Always conduct your own research and manage risk accordingly.

XRPUSDT is trading around 1.40 USDT following a sharp rally to nearly 1.49 and a subsequent pullback. On the positive side, the price remains above the EMA34–EMA89 levels (around 1.38), while the 1.31–1.36 range continues to serve as a critical "Buy Zone." Technically, XRP remains within a descending channel; therefore, the 1.43–1.46 zone represents a hurdle that must be cleared. If the price pulls back but holds the 1.35–1.38 range before breaking out of the channel's upper boundary, I lean toward the scenario of XRP extending to 1.50–1.55 before targeting the key level around 1.59 USDT. XRP is showing positive signs regarding capital flow. FXStreet reported a gain of over 6% in the previous session, while the Long/Short ratio in the derivatives market has risen to approximately 1.15, indicating that market positioning favors the bulls. Additionally, today's procedural vote on the CLARITY Act in the US Senate could act as a catalyst for the broader cryptocurrency market. The bullish scenario would be invalidated if XRP decisively loses the 1.31–1.33 zone. Will XRP hold the Buy Zone and break the descending channel to target 1.59?
This chart presents an Elliot wave count for XRP/USD on the daily timeframe. The initial strong move has been labeled as wave (1), followed by a corrective wave (2). The primary and secondary counts suggest that we might be in the early stages of a powerful wave (3). The count is broken down as follows: Wave (1): Initial impulse. Wave (2): Corrective phase, completing as an ABC. The structure looks solid. Wave (3) : A smaller degree 1-2 sequence appears to have formed, and a breakout here would confirm the impulsive nature of a larger wave 3. Invalidation level 0.97 Remember to consider alternative counts and manage risk appropriately. This analysis is for informational and educational purposes only. It is not financial or trading advice. Cryptocurrencies are volatile and carry high risk. Always do your own thorough research before making any investment decisions. I am not a financial advisor. Previous performance is not indicative of future results."

The XRP Ledger’s Batch V1.1 amendment has moved within one validator vote of starting its two-week activation process after developers fixed another 11 software issues uncovered during security reviews. RippleX said Monday that the latest review of Batch V1.1 identified…

XRP and XLM prices exploded more than 8% on September 14, as traders positioned ahead of a pivotal Senate procedural vote on the Digital Asset Market Clarity Act (CLARITY Act). XRP climbed to $1.47, up 8.42%, while XLM surged even harder to $0.1949, gaining 8.44%. What’s Driving the Rally in XRP and XLM The CLARITY
 BeInCrypto•Luis Blanco15 Sept
 CoinDesk•Shaurya Malwa15 Sept
Lots of bullish confluence at the moment on XRPUSD’s 1 day chart here. First off we just closed our 1st daily bullish candle above the top trendline of the bullflag. Secondly the stochrsi has been in the fully reset / oversold zone for over a week now and has just now dipped back up into the bullish zone. Thirdly, the golden cross is likely to occur sometime this week and price action is still relatively close to the 200ma which increases the probability of a sustained golden cross. Lastly tomorrow(Tuesday) at 2:15pm est they are holding the cloture vote for the clarity act. Normally I would expect an event like this to result in a sell the news event, but since they have spent the majority of the past few months scaremongering about how there is no way they will have enough votes for it to pass, I think then if it does pass it could very easily coincide with a market wide pump instead of the usual sell the news dump. We will know soon enough. For now I think the probability is higher this bullflag will validate the bullish breakout rather than become a fakeout, always smartest to wait for a clear validation first though. If it were to validate the breakout on the current break above the flag, the measured move target is $1.96 . It might very well do a dump fakeout back inside the flag on the day of the cloture vote only to reverse course once the golden cross happens and then have the real breakout. Stay vigilant. *not financial advice*