BTC Settles at $77K After a Wild Ride, ETH Slumps Following Major Rally: Weekend Watch
Cobertura cronológica
 Primera noticia12 sept, 10:13
BTC Settles at $77K After a Wild Ride, ETH Slumps Following Major Rally: Weekend Watch
The privacy coins ZEC and XMR have rocketed once again on a daily scale.
CryptoPotato•Jordan Lyanchev
 Seguimiento12 sept, 23:00
13.6K BTC flush resets leverage – But Bitcoin’s rally to $82k has THIS hurdle
Bitcoin was yet to climb above the key long-term resistance zone around $82k, and was at risk of losing the short-term bullish momentum, too
 AMBCrypto•Akashnath S
 Seguimiento13 sept, 04:00
Morgan Stanley’s $50.6M BTC buying shields market – But rally to $82K has THIS hurdle
Institutional accumulation and persistent exchange outflows support Bitcoin as BTC defends its crucial order block.
AMBCrypto•Evans Boto Seguimiento13 sept, 07:15
Top 100 Viral Altcoin Explodes by 325% Daily, BTC Struggles at $77K: Weekend Watch
The asset itself has rocketed by 800% weekly and is now the 92th-largest by market cap.
 Seguimiento13 sept, 09:00
Bitcoin: $85M whale buy meets Fed FUD – Is BTC setting up a bear trap?
Bitcoin is holding $75k despite rising rate-hike odds. An $85 million whale purchase could signal a potential bear trap.
AMBCrypto•Ritika Gupta Seguimiento13 sept, 21:20
Hackers mint trillions in fake Bitcoin, but 15 BTC bridge recovery leaves liquidity providers unpaid
The native bridge remains paused as a 20% bounty window closes Sep. 13 and final accounting continues.
 CryptoSlate•Liam 'Akiba' Wright
 Seguimiento14 sept, 05:42
Symbiosis recovers 15 BTC after attacker mints billions of syBTC
Cross-chain liquidity protocol Symbiosis has recovered approximately 15 BTC after an attacker exploited its Bitcoin Bridge, while its native bitcoin route remains suspended and affected liquidity providers await a compensation plan. Symbiosis said the security incident occurred on Sept. 11…
Crypto.news•Rony Roy
 Seguimiento14 sept, 07:39
Capital B buys additional 4 Bitcoin, increasing total to 3,525 BTC
Capital B's equity-funded Bitcoin strategy minimizes debt risk but poses shareholder dilution, betting on BTC appreciation to justify the trade-off.
 CryptoBriefing•Editorial Team
 Seguimiento14 sept, 09:38
Revolut Customer Records Exposed: Attackers Demand 10,000 BTC
A Revolut data breach exposed identity records and Bitcoin transaction histories after a fraudulent government-domain request cleared checks.
CryptoNews•Ahmed Barakat
 Seguimiento14 sept, 15:11
Market Maker FOMC Plan: BTC Setup & Execution
Thos who read it first time please cheack prev post first That first-move expansion played out precisely into the liquidity pocket we mapped. Taking partials here and shifting stop-loss to breakeven locks in a risk-free structure while leaving runners open for the broader expansion. Securing the bag and never letting a green session turn red is the exact execution discipline that keeps the equity curve scaling. Let's see how the market maker model prints into the next session cheers !!
TITradingView Ideas Seguimiento14 sept, 15:15
Strive reaches 25,000 BTC milestone with latest $36.6 million purchase
The latest acquisition marks a slowdown from the prior week, when Strive purchased 1,375 BTC for approximately $109 million.
 The Block•Kyle Baird
 Seguimientohace 21 h
BTC - Earth to Major Tom
A long trade is explicitly shown as active, with the runner extended and target progress at 100%. The visible instruction is HOLD RUNNER — TRAIL STOP / MANAGE NOW, not a fresh long entry. Protect gains and avoid chasing after the move has already extended.
TITradingView Ideas Seguimientohace 21 h
BTC Holds $76K, Is $82K the Next Breakout?
CRYPTOCAP:BTC is remaining comfortably above the $76K support region and bouncing nicely. But the $82K resistance levels is still a big struggle on the upside. A decisive break and close above $82K can play big role on changing the market structure and pave way for a large up move. Until we see a rally, keep position sizes small and be patient. DYOR, NFA
TITradingView Ideas Seguimientohace 17 h
btc liq grab
The upper level has already been tested multiple times; there are still two small areas left open. This presents an opportunity for a liquidity grab followed by a move back down, or—of course—a breakout; since the two open areas are relatively close together, one could play the move through both of them in a single trade (not sure about this, please add to discussion). also trend is slightly upwards so entry therefore higher in range? (also not sure)
TITradingView Ideas Seguimientohace 14 h
BTC CHART UPDATED
Updated view of BTC chart on 4h timeframe. Long term move much clearer looks like were at bottom of wave 4. Expecting wave 5 move to 83/84K before exhaustion
TITradingView Ideas Seguimientohace 14 h
BTC 30m Update | 80K Still Possible | Pink Wave Y Unconfirmed
# Bitcoin Market Analysis (BTCUSDT) ## Quick Summary **Bias:** Neutral / Waiting for Confirmation **Timeframe:** 30m **Potential Extension:** 80K **Current Structure:** Pink Wave X remains unconfirmed **Status:** Waiting for the next signal --- # Current Scenario On the **30m timeframe**, I am currently waiting for another potential extension toward **80K**. However, the signal confirming the **start of this extension has not appeared yet**. At the same time, the confirmation for the **end of Pink Wave X** has also not appeared. For now, I will continue monitoring the structure rather than assuming that either scenario has started or completed. --- 👍 If you find this analysis useful, don't forget to follow **MAS Crypto Analysis** for future Bitcoin updates. *This publication is intended for educational and market analysis purposes only and does not constitute financial advice.* #Bitcoin #BTCUSDT #BTCUSD #Crypto #PriceAction #ElliottWave #WaveAnalysis #SupplyAndDemand #TrendAnalysis
TITradingView Ideas Seguimientohace 13 h
BTC Holds the Line — Is $82K Next?
BTC/USD currently looks more like a consolidation above support than the beginning of a deeper decline. After repeatedly testing the 76,000–77,000 area, price has been quickly pushed back up each time — a sign that buyers are still actively absorbing selling pressure at lower levels. More importantly, the recent pullbacks have yet to break the key H4 support zone. Price is trading around the Ichimoku Cloud and continues to attract buying interest whenever it approaches the lower end of the structure. This type of price action suggests that BTC may be compressing inside a broader range rather than developing a new bearish trend. If buyers manage to reclaim the area above the Ichimoku Cloud, recovery momentum could accelerate quickly. However, the macro backdrop remains a major obstacle. Expectations of a Fed rate hike following hotter-than-expected U.S. inflation, elevated Treasury yields, and weaker Bitcoin ETF flows have all been putting pressure on risk assets. As a result, any BTC rally ahead of the FOMC decision could still come with sharp volatility and short-term pullbacks. If BTC continues to hold the 76,000–77,000 support zone, I expect price to have a chance to recover toward the major resistance area around 81,500–82,000. This will be the real test for buyers — only a decisive break above this zone would open the door to a larger bullish move.
TITradingView Ideas- TISeguimientohace 13 h
SCENARIO ANALYSIS: BTC VS Altcoins Reversal chart patterns
Charting BTC market cap dominance versus Alt-coin dominance calculated by CRYPTOCAP on Tradingview Potential Chart Patterns: Head & Shoulders (reversal) Descending Wedge (continuation) HTF Jack & Jill (Topping Pattern) Which way will it break? Will BTC dominance continue to take marketshare from the Others?
TITradingView Ideas  Seguimientohace 11 h
Strategy repurchases $139M STRC as its treasury hits 845,050 BTC – Details
Strategy’s liquidity has seen a 13× surge since 2023.
AMBCrypto•Ishika Kumari Seguimientohace 10 h
BTC sells.
Bitcoin to sell from 79529 to 62274 Sell Bitcoin through out month. See you later.
TITradingView Ideas Seguimientohace 7 h
BTC
BTC is showing signs of weakness after the recent rally. I expect a correction before the next move.
TITradingView Ideas Seguimientohace 7 h
BTC – Bearish Distribution Below 76,9K....BART SIMPSON Movement?
BTC has spent 25 days trapped in a sideways channel after a sharp expansion, and price action is leaning toward a distribution breakdown. 🟠 Why This Level Matters: The first week delivered a strong impulse move, followed by a 3-4 week range that could be read as either accumulation or distribution. On the 4H, the extended range and current structure point toward distribution. The local neckline is the line that decides the next leg. 🟠 Gameplan / Primary Scenario: Sell the breakdown once price loses the local neckline, which should trigger this week or next. A confirmed break opens the door for stronger downside momentum, targeting a return toward the local lows near 65,000. Until that break confirms, treat rallies inside the range as fuel for the move lower. For context, there is no reasonable case for markets to reverse and push higher yet. That environment is likely 3-5 months out, if not longer. If this added value, boost it forward. What are your thoughts? Swallow Academy
TITradingView Ideas Seguimientohace 6 h
MEXC’s September 2026 Proof of Reserves Reaffirms Full Backing of User Assets, BTC Reserve Ratio Increases to 297%
Mutsamudu, Comoros, September 15, 2026 – MEXC, a pioneer in 0-fee digital asset trading, has released its September 2026 Proof of Reserves (PoR) report, audited by Hacken, confirming that user assets remain fully backed across all major reserve assets. The BTC reserve ratio increased to 297%, up from 288% in August. MEXC continues to disclose reserve data on a monthly basis, aiming to enhance transparency and safeguard the security of user funds. According to the audited report, dated as of the September 10, 2026 snapshot, reserve ratios for all disclosed assets are as follows: BTC: 297%. Reserves of 12,202.13 BTC cover 4,106.57 BTC in user holdings. USDT: 119%. Reserves of 1,818,202,910.24 USDT cover 1,526,526,878.38 USDT in user holdings. USDC: 111%. Reserves of 299,925,929.77 USDC cover 269,894,125.25 USDC in user holdings. ETH: 111%. Reserves of 58,917.60 ETH cover 53,243.98 ETH in user holdings. MEXC verifies its reserves through Merkle Tree technology, allowing individual users to confirm their balances are included in the total reserve calculation without exposing other users’ data. For this month’s audit, Hacken conducted a comprehensive evaluation of MEXC’s reserves, covering Proof of Liabilities, Proof of Ownership, Reserves Calculation, and a PoR Assessment. Hacken confirmed that MEXC’s reserves exceed a 1:1 ratio across all in-scope assets, fully covering user liabilities. “Protecting user assets and earning their trust are fundamental responsibilities, not optional commitments,” said Vugar Usi, CEO of MEXC. “In an industry where confidence has been tested time and again, transparency must be demonstrated through actions that users can independently verify. That is why we publish verifiable Proof of Reserves every month, giving users the ability to validate their asset data at any time rather than simply relying on our assurances. Our commitment is to continue raising the standard for transparency, accountability, and asset protection, and to build the kind of trust that is earned consistently over time.” To further protect user assets, MEXC maintains the Futures Insurance Fund, which absorbs losses from liquidations triggered by extreme market conditions. The fund held a balance of approximately 798 million USDT as of press time. MEXC also operates The Guardian Fund, a dual-reserve structure combining USDT and BTC holdings that offers full compensation coverage for platform-related issues. It held a balance of $101 million as of press time and plans to expand to $500 million within two years. To view the latest Proof of Reserves snapshot and audit report, please visit the MEXC Proof of Reserves page. About MEXC Founded in 2018, MEXC is a leading global multi-asset trading platform built as your 0-fee gateway to infinite opportunities. Serving users across 170+ markets, MEXC provides simple and efficient access to crypto, stocks, tokenized assets, derivatives, and a growing range of TradFi-linked opportunities through one account and one gateway. With 0 trading fees, deep liquidity, broad asset coverage, and a high-performance trading experience, MEXC is designed for retail users who want to discover earlier, act faster, and trade with fewer barriers. As crypto and traditional finance continue to converge, MEXC is committed to making global opportunities more accessible, helping users trade freely and MEXCmize every opportunity. MEXC Official Website| X | Telegram |How to Sign Up on MEXC For media inquiries, please contact MEXC PR team: media@mexc.com Risk Disclaimer: This content does not constitute investment advice. Given the volatility of financial markets, including digital assets, tokenized assets, and traditional financial products, investors should carefully assess market conditions, underlying asset fundamentals, and potential financial risks before making any investment or trading decisions. Source
 NewsBTC•BlockmanPR
 Seguimientohace 6 h
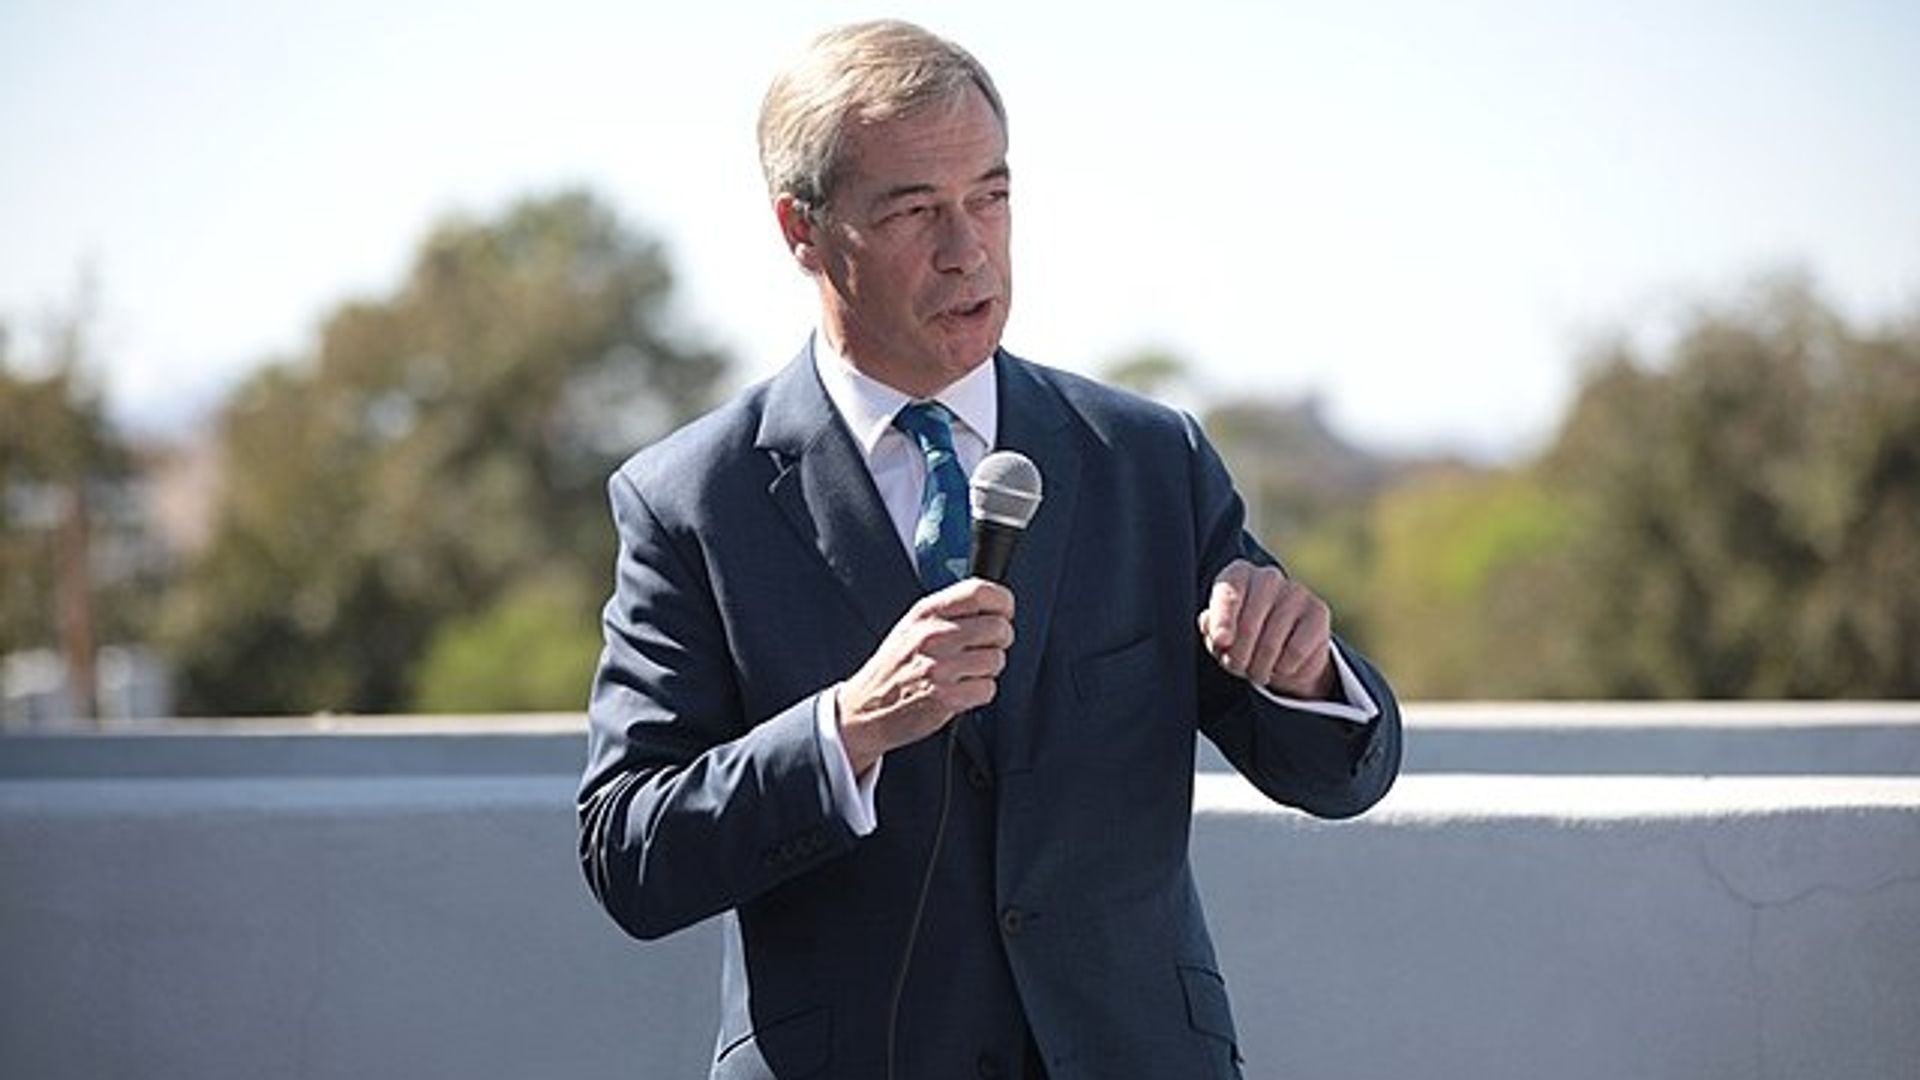
Nigel Farage-backed Stack BTC eyes $16 million gold dealer deal to fund bitcoin buy
 CoinDesk•AI Boost
 Seguimientohace 6 h
Stack BTC seeks $16M gold dealer acquisition to fund Bitcoin purchases
Stack BTC's acquisition strategy could redefine funding models for Bitcoin treasury firms, emphasizing organic cash flow over traditional methods.
CryptoBriefing•Editorial Team- Seguimientohace 6 h
BTC Pink Wave Y | 76.15K Key Level
# Bitcoin Market Analysis (BTCUSDT) # Current Scenario Finally, BTC has given the signal confirming: 🔴 **Pink Wave X → Completed** Now, the key level I am monitoring is: **76.15K** A break below this level followed by a sustained move below it would provide stronger confirmation for the continuation of Pink Wave Y. Until that happens, I will continue monitoring the structure step by step. --- 👍 If you find this analysis useful, don't forget to follow **MAS Crypto Analysis** for future Bitcoin updates. *This publication is intended for educational and market analysis purposes only and does not constitute financial advice.* #Bitcoin #BTCUSDT #BTCUSD #Crypto #PriceAction #ElliottWave #WaveAnalysis #SupplyAndDemand #TrendAnalysis
TITradingView Ideas  Seguimientohace 5 h
BTC Failed Under 78,028 And Is Working Toward 76,237.
BTC Failed Under 78,028 And Is Working Toward 76,237. Bitcoin never reclaimed 78,028 after the weekend sweep of 79,852 and has spent two sessions drifting lower, down 1.50% to 77,004 with 76,237 the next level beneath it and 76,030 - Friday's sweep low - under that. The line that capped it all last week is now firmly overhead, and the failure to reclaim it is what turned the weekend high into a sweep rather than a break. The two timeframes disagree sharply: the hourly carries a long-reversal state on elevated volume while the 4H sits at a short read with conviction near the bottom of its scale. Neutral. Resistance: 78,028 - the line overhead Key resistance: 79,318 - the level rejected four times Current price: 77,004 Support: 76,237 - the next level down Key support: 76,030 - the sweep low Structural floor: 74,182 - deeper floor Two paths from here: It works down to 76,237 and retests 76,030. Continuing under 78,028 puts the recent low in play, and a close beneath 76,030 would finally break the range that has held since last week, opening the space toward 74,182 with nothing named in between. It reclaims 78,028 and the drift ends. Getting back above the line would make these two sessions a pullback inside the range rather than the start of the next leg, though 79,318 still caps everything above it. Both ends of this range have been swept in the last four sessions and price is grinding back toward the low end. 78,028 above, 76,030 below - and the low is the one being approached. Built with SYNTHESIS v3.3 | SOM / ACE / IMP / SYNTHESIS Study, not financial advice.
TITradingView Ideas- Seguimientohace 4 h
BTC USD Analysis: Oil, Fed and Senate Uncertainty Weigh on Bitcoin
Bitcoin retreats toward $77,800 as the CLARITY Act Senate vote meets rising oil prices, inflation fears and a looming Federal Reserve decision on Tuesday.
 99Bitcoins•Alex Ioannou
  Seguimientohace 3 h
BTC & ETH at the Crossroads: Bull Trap or Breakout Ahead of FOMC
Analysis Breakdown: Bitcoin ( BITSTAMP:BTCUSD - 4H / 6H): Following an impulse completion, price has entered an extended corrective consolidation. After multiple failed attempts to hold short entries near the highs, the broader bias leaned bearish as price rejected upper resistance. Current structure tracks an A-B-C corrective sequence: Failure to establish acceptance above the local range keeps downside targets active toward $75,500 (Wave C), with deeper continuation levels down to $74,400. Recent aggressive sell-offs have erased weekend gains, placing BTC right back into key mid-range decision territory. Ethereum ( BITSTAMP:ETHUSD - 2H / 4H): ETH recently tapped above range highs near $2,500+ before leaving pronounced upper rejection wicks—raising significant bull trap concerns. Price is currently testing ascending channel/wedge support. A sustained breakdown below this trendline opens up retests toward $2,416 and the lower support block. Only a clean reclaim and acceptance above local resistance invalidates the downside play. [ Solana ( COINBASE:SOLUSD - 2H): Consolidating within a narrowing triangle structure around the $100–$101 level. Holding base support keeps short-term scalp upside alive toward triangle resistance, but a breakdown follows broader market weakness. Macro Catalysts: High volatility expected mid-week with upcoming US Retail Sales and the pivotal FOMC Rate Decision / Fed Press Conference. Watch for false breakouts and liquidity sweeps before committing to directional swings.
TITradingView Ideas Seguimientohace 3 h
Strike CEO Jack Mallers: Inflation Outlook, Bond Stress and BTC vs Gold
Bitcoin Magazine Strike CEO Jack Mallers: Inflation Outlook, Bond Stress and BTC vs Gold US debt-to-GDP has pushed past 120%, and Jack Mallers thinks the debate over whether the Fed hikes or cuts is beside the point, both roads lead to inflation. This post Strike CEO Jack Mallers: Inflation Outlook, Bond Stress and BTC vs Gold first appeared on Bitcoin Magazine and is written by Patrick Green .
Bitcoin Magazine•Patrick Green
 Seguimientohace 3 h
BTC | Structure Shifted, Five Pools Sit Above
By analyzing the #BTC (Bitcoin) chart on the Daily timeframe, we can see a market that spent almost a year making lower lows, swept the liquidity beneath them, and has since shifted structure upward with enough force that the entire range above is now unclaimed liquidity. ━━━━━━━━━━━━━━━━━━━━ DAILY TIMEFRAME ━━━━━━━━━━━━━━━━━━━━ The downtrend. From the November high at $116,323.39 price moved in one direction. Each rally failed lower than the last, and in February the BMS confirmed it — the November swing low was broken and the bearish structure was formally set. Every bounce after that was sold into. The sweep. The low did not come from strength. In early July price drove through the February low into the stops resting beneath it — a clean liquidity sweep — and printed the Protected Low at $57,664.45 . That is the origin of everything that followed. The shift. From that low price built a base through July and August, then in late August broke the structure to the upside with the MSS . The way it broke matters more than the fact that it broke: the move left clear bullish fair value gaps behind it and expanded vertically rather than grinding. Displacement like that is how a real shift looks. Price is now at $77,037.28 . ━━━━━━━━━━━━━━━━━━━━ THE LIQUIDITY ABOVE ━━━━━━━━━━━━━━━━━━━━ Five untouched pools of buy-side liquidity sit overhead, each one an old high that was never revisited: BSL 1 — $82,875.74 BSL 2 — $90,609.88 BSL 3 — $98,042.69 BSL 4 — $107,584.81 BSL 5 — $116,323.39 A high that has never been defended isn't resistance, it's a target. Five of them stacked in sequence is the road map for the rest of this move. ━━━━━━━━━━━━━━━━━━━━ THE BIAS ━━━━━━━━━━━━━━━━━━━━ Bullish. The structure shifted, the displacement was real, and the liquidity is all on one side. ━━━━━━━━━━━━━━━━━━━━ SCENARIO A — THE BASE CASE ━━━━━━━━━━━━━━━━━━━━ Chasing here is the worst version of this idea. The better entry sits below the 0.5 retracement of the impulse leg — the area just above $70,000 . Price is extended from its origin, and a pullback into discount is the normal behaviour after displacement of this size. The first objective on a reaction from there is BSL 1 at $82,875.74 , and above it the ladder opens. ━━━━━━━━━━━━━━━━━━━━ SCENARIO B — THE DEEPER RETRACE ━━━━━━━━━━━━━━━━━━━━ The stronger area is lower. The RBS zone at $65,097.26 – $67,206.58 is where the resistance that capped price from April through August was broken and flipped. It also overlaps the 0.62 ($67,206.58) and 0.705 ($65,097.26) retracement levels of the same impulse. Broken resistance, deep discount and a fib cluster in the same band is as much confluence as this chart offers. If price reaches it and the daily prints a buy signal there, that is the high-conviction entry — same targets, materially better price. ━━━━━━━━━━━━━━━━━━━━ INVALIDATION ━━━━━━━━━━━━━━━━━━━━ A daily close below the Protected Low at $57,664.45 . That level is the origin of the shift; beneath it the July sweep failed and the bullish structure is gone. An earlier warning comes first: a daily close below $65,097.26 that does not reclaim means the RBS zone failed as demand, and the entry thesis is broken well before the structure is. And the rule that governs all of it: a break is a candle close, not a wick. The RBS zone is exactly where a wick beneath will look like failure and close back inside — that band held price for four months, which means it is thick with stops on both sides, and thick stop clusters are what wicks are made from. ━━━━━━━━━━━━━━━━━━━━ FUNDAMENTAL BACKDROP ━━━━━━━━━━━━━━━━━━━━ The supportive side. US spot Bitcoin ETFs just closed their strongest three-week stretch of 2026 at $3.8 billion in combined inflows, including $986.9 million in the week ending September 5. Total net assets across the products reached $101.3 billion , and the 50-day and 200-day moving averages converged into a golden cross around September 11 . The previous three completed crosses were followed by moves of 50%, 45% and 60% . The opposing side. This is not a clean macro picture. Markets are pricing a 58.4% probability of a 25bp rate HIKE at the September 15–16 FOMC — happening right now, not a cut. July PCE inflation ran at 3.7% year over year , August payrolls came in at 162,000 , and Brent near $97 is feeding the inflation problem. Year-to-date ETF net flows are still roughly $1 billion negative despite the recent surge, and a golden cross is a lagging signal that has reversed within weeks before. The link. The FOMC outcome is the most likely cause of the retracement this idea is waiting for. A hawkish result does not break the structure — it hands the discount entry the chart is already asking for. Which is the entire point of having the levels marked before the event rather than reacting after it. This analysis will be updated as the market evolves. Best Regards, BigBeluga 🐳
TITradingView Ideas Seguimientohace 2 h
A hacker turned 25 cents of bitcoin into 46 billion fake BTC tokens on a DeFi bridge
CoinDesk•Shaurya Malwa- TISeguimientohace 2 h
5th BTC cycle projection
Capture the previous Bitcoin recent cycles Projecting out potential top point ranges for this next cycle We are in accumulation mode
TITradingView Ideas 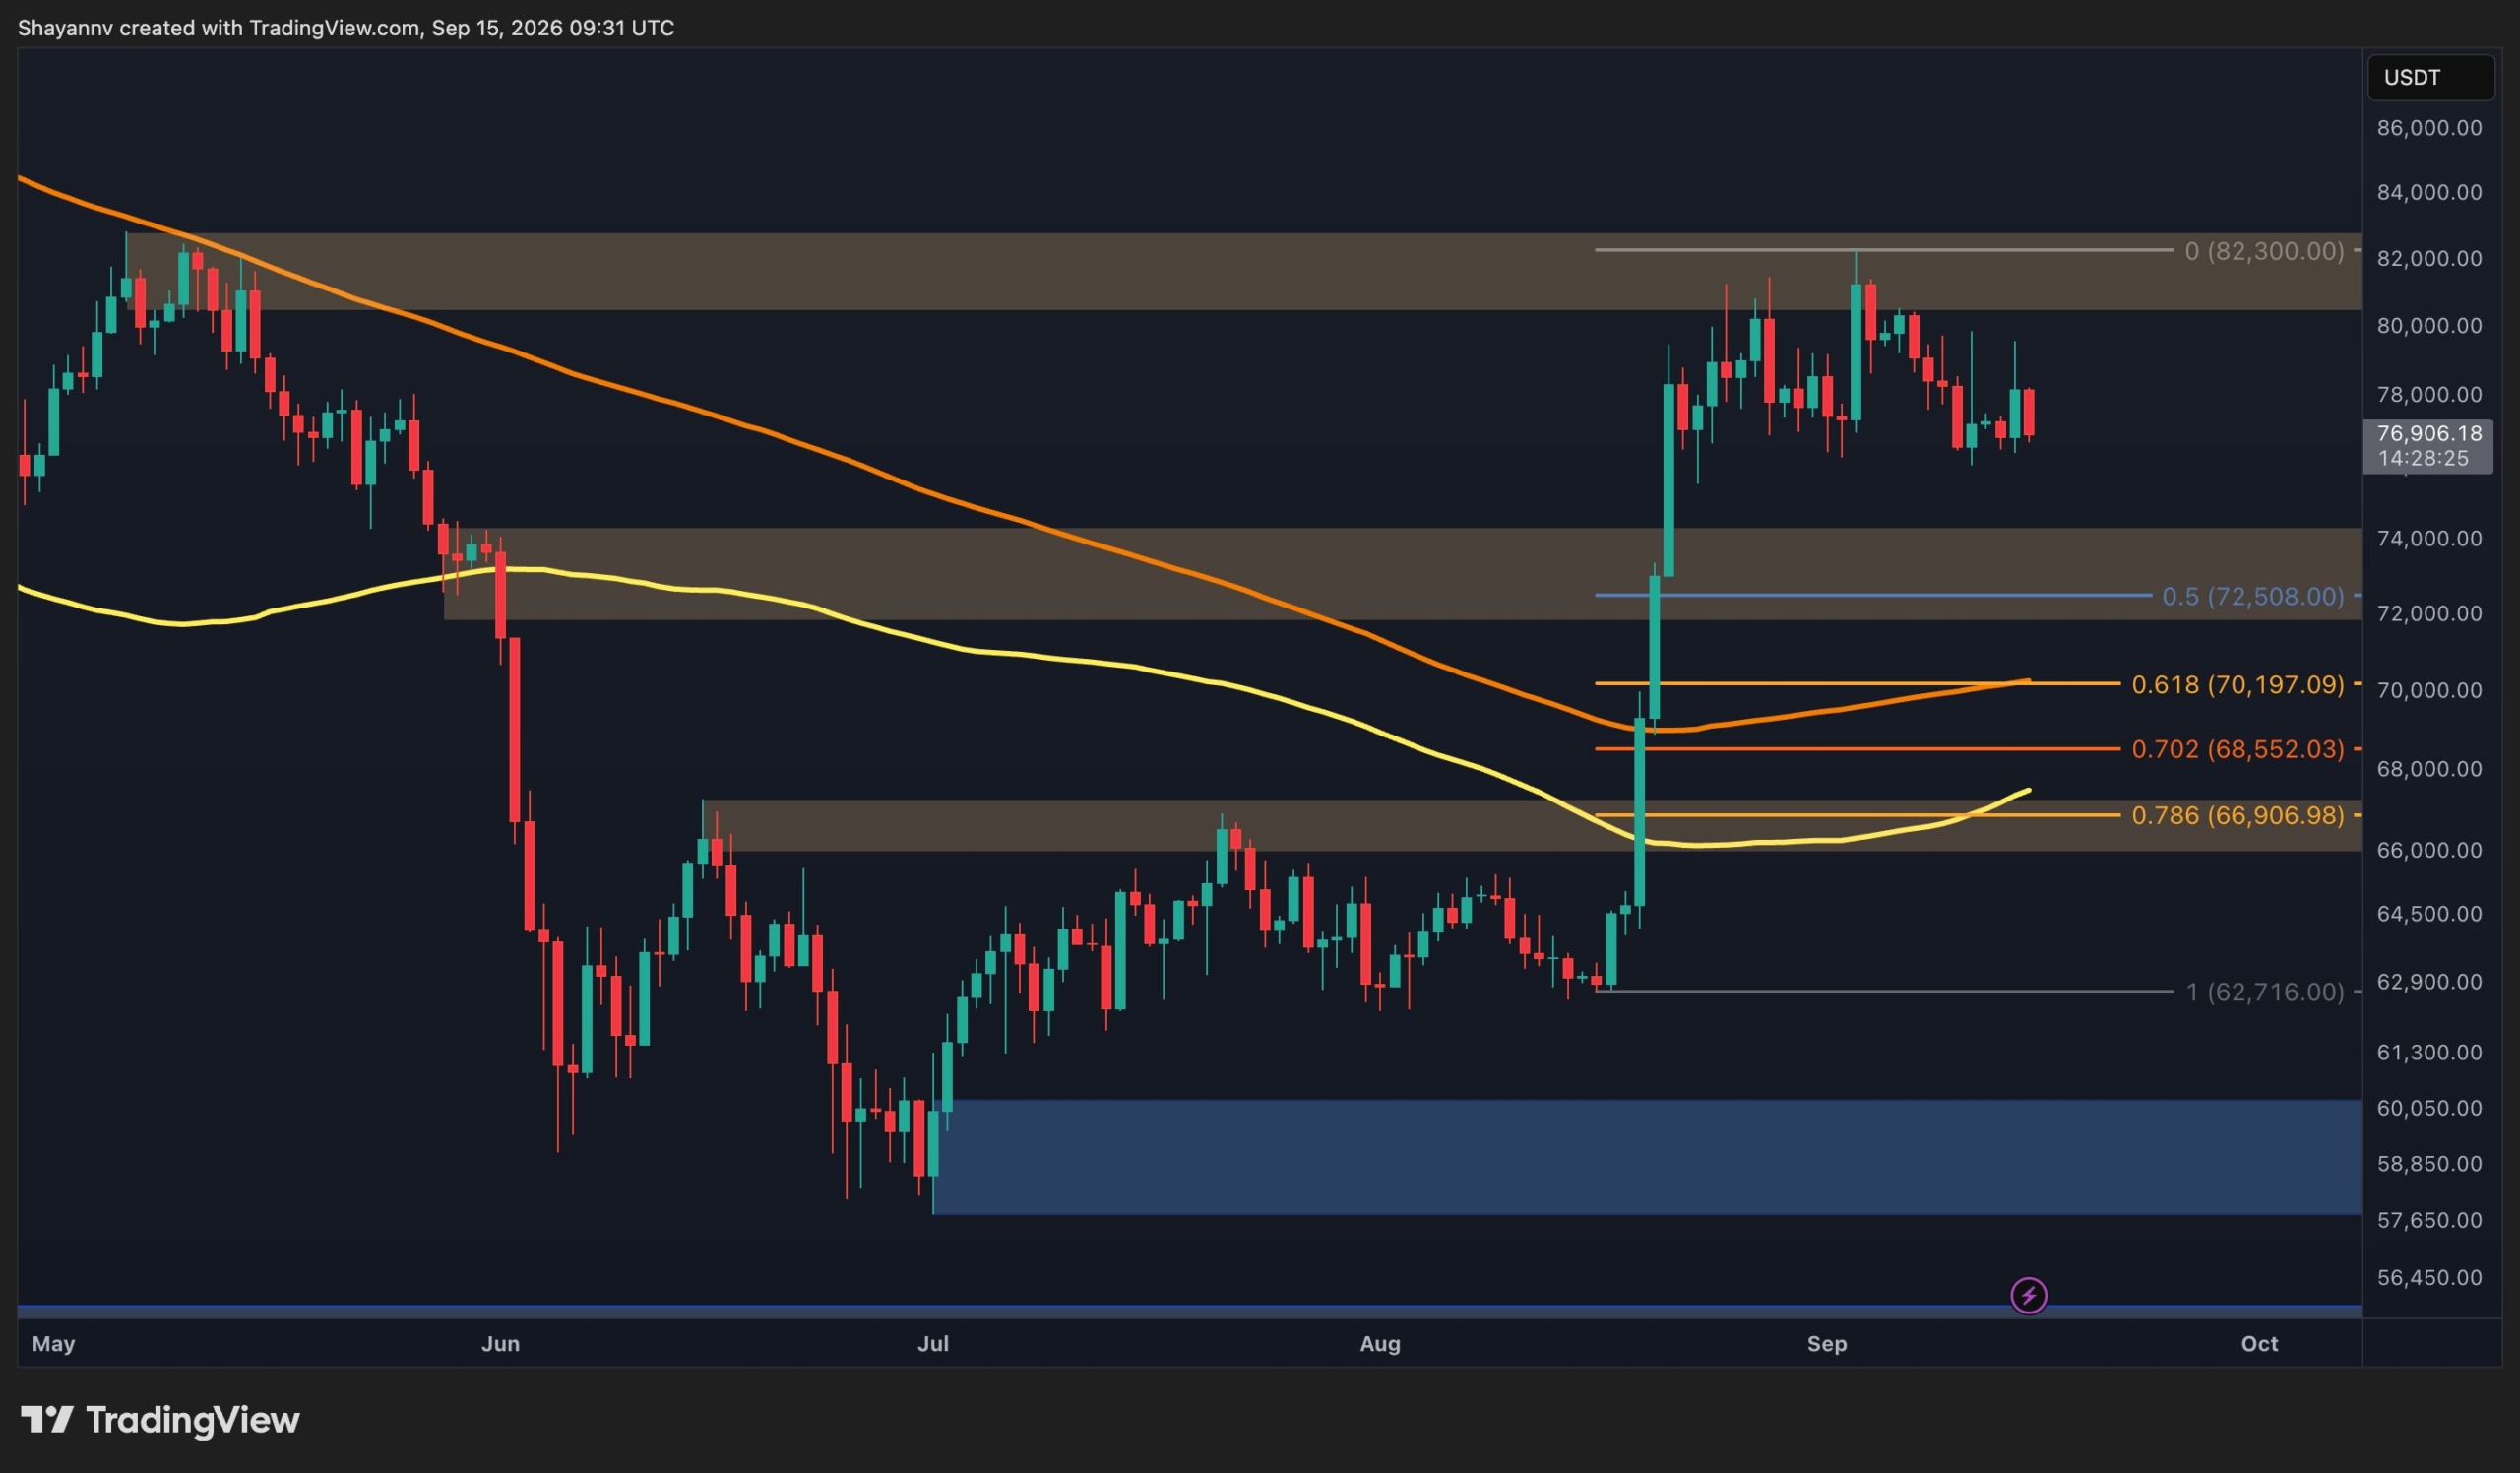 Seguimientohace 2 h
Bitcoin Price Analysis: BTC Tests Key Support Ahead of Crucial FOMC Decision
Bitcoin is entering a potentially decisive macro catalyst with its short-term structure already under pressure. The asset has drifted back toward the lower boundary of its recent consolidation, while the market awaits tomorrow’s FOMC interest-rate decision, an event that could trigger a sharp expansion in volatility as expectations remain heavily skewed toward a rate increase. […]
 Seguimientohace 2 h
Hacker turns 25 cents of Bitcoin into 46 billion fake BTC tokens on Symbiosis bridge
The exploit highlights the persistent vulnerabilities in cross-chain bridge infrastructure, underscoring the urgent need for enhanced security measures.
CryptoBriefing•Editorial Team- Más recientehace 1 h
BTC Breakdown Incoming? Critical Support Under Pressure
CRYPTOCAP:BTC is struggling to hold the current support zone. If the price fails to defend this level, we could see a sharp drop from here. Stay alert and tuned in for the next move. DYOR, NFA
TITradingView Ideas