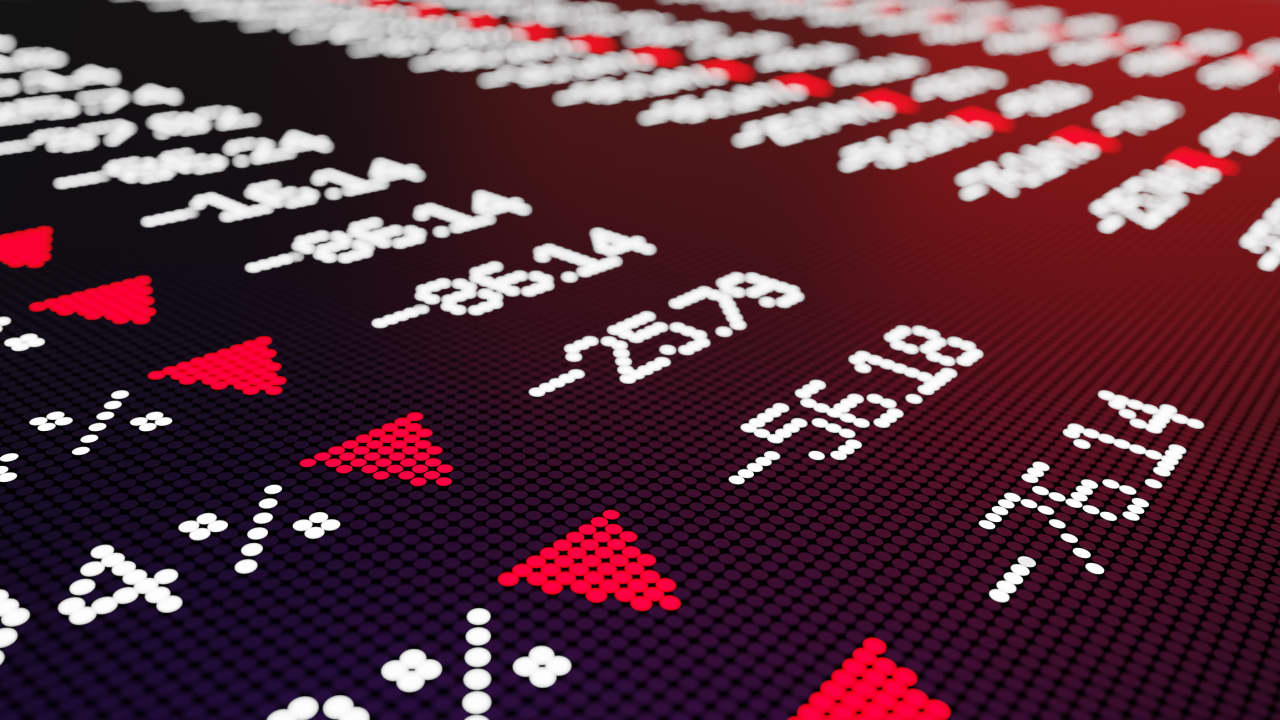
Soaring Oil Prices Put Fed on Track for September Rate Hike
Cobertura cronológica
 Primera noticia14 sept, 08:00
Soaring Oil Prices Put Fed on Track for September Rate Hike
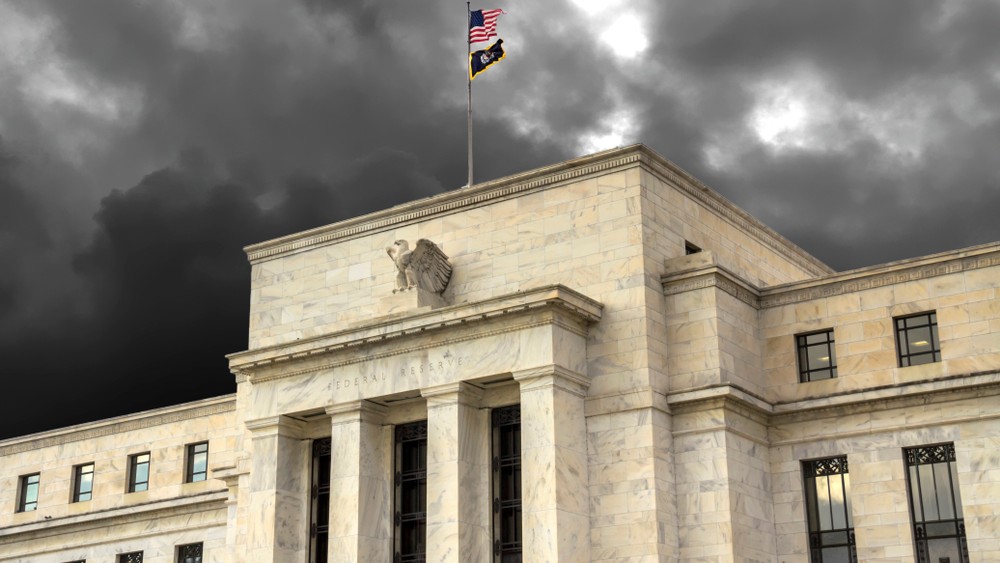
The recent spike in crude oil prices will likely result in a fresh rate hike by the Fed this week, according to data from CME Group, cited by The National today. As much as 90% of respondents from trading circles expect a rate hike of 25 basis points, after last week, the European Central Bank hiked interest rates by the same amount. “The conflict in the Middle East continues to generate inflation pressures, and inflation is set to remain well above target for an extended period,” the ECB said in its decision. “People are finally…
OilPrice.com•Irina Slav
 Seguimiento14 sept, 13:45
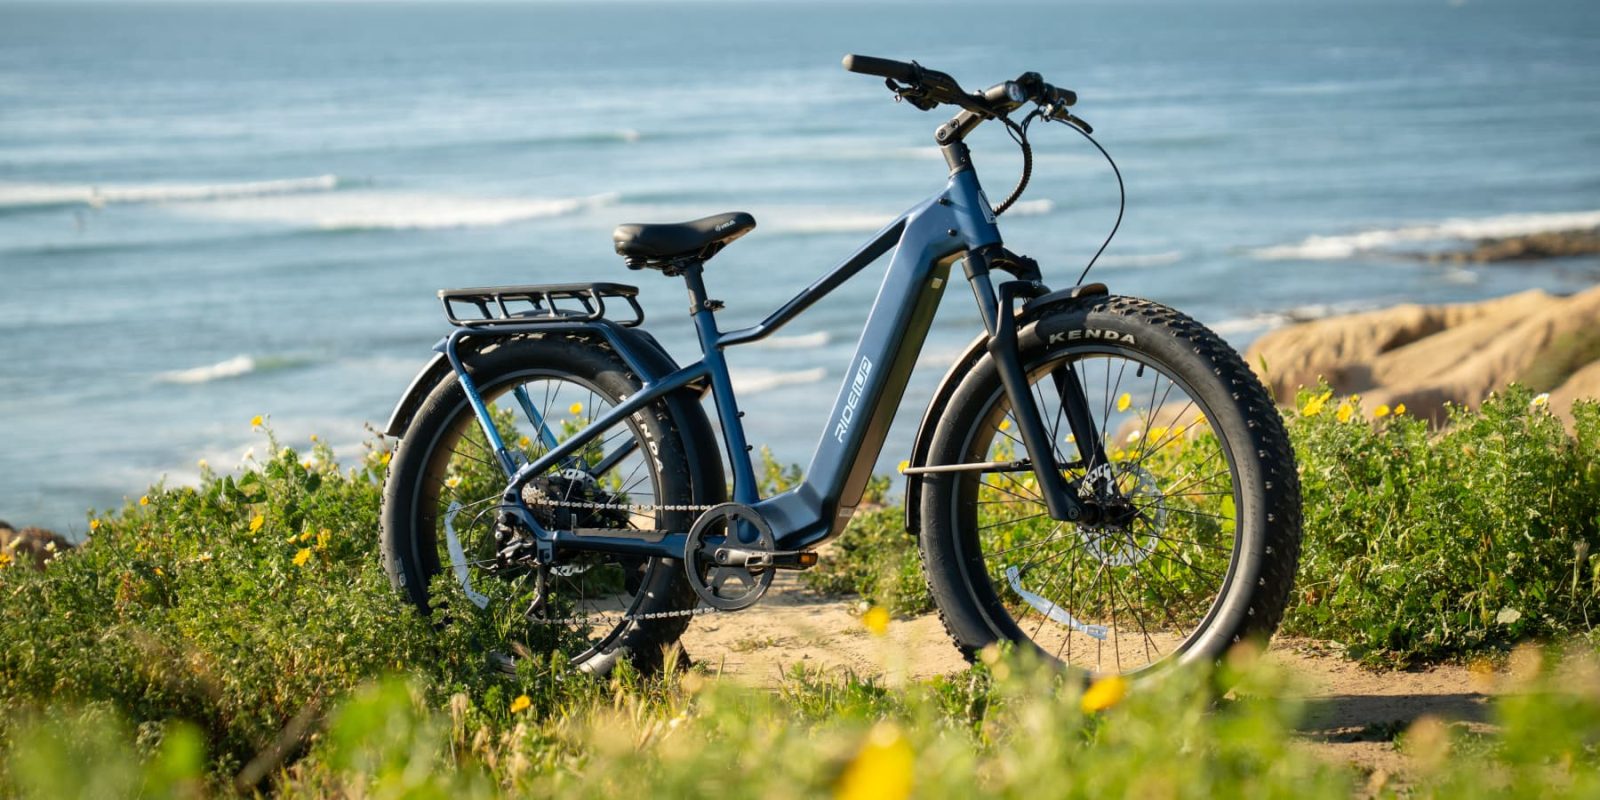
Here are the best electric bikes you can buy at every price level in September 2026
I’ve spent countless hours here at Electrek doing detailed hands-on testing of hundreds of electric bikes. Through thousands of miles of riding, I’ve been fortunate to learn these e-bikes inside and out, top to bottom and front to back. That long-term experience with real-world e-bike testing has helped me find the best electric bicycles on the market for just about any budget. Below are some of the top e-bikes I’ve hand-tested for every price range, current as of September 2026. Fall weather is just around the corner, so it’s a great time to hop in the saddle and get out there riding! Check out the awesome e-bikes below, any one of which could become your next electric bike. more…
 Electrek•Micah Toll
 Seguimiento15 sept, 11:51
AAPL | September 15, 2026 | Trend Lines & Fibonacci Confluence
Today's AAPL review focused on **trend lines and Fibonacci levels—and how the two can work together to create confluence.** Instead of using either tool by itself, we looked at how trend lines can help define the structure and direction of price, while Fibonacci retracements can help identify potential areas where a pullback may find a reaction. In today's video, I covered: * Using trend lines to understand the current price structure * Drawing Fibonacci levels around the move we're analyzing * Understanding retracement levels instead of treating them as automatic entries * Looking for areas where a Fib level and trend line come together * Why overlapping technical clues can make a point of interest more meaningful * Waiting for price action to confirm the idea before taking the trade The bigger lesson is that **a line on the chart isn't an edge by itself.** A trend line gives us one piece of information. A Fibonacci level gives us another. When those tools begin pointing toward the same area, we have confluence—and that's when I start paying closer attention. The goal isn't to predict exactly where AAPL will turn. It's to identify areas where the probabilities may become more interesting and then let price tell us whether our idea is right. Dad Stock Joke: I asked Fibonacci and my trend line why they kept meeting at the same spot. They said, “It's not a coincidence, we've got a level of understanding.” 📈😄
TITradingView Ideas- Seguimiento15 sept, 20:20
Dow clinches its worst September start since 2008 as history repeats itself
The Dow Jones Industrial Average on Tuesday posted its worst performance during the first 10 days of September since 2008.
MarketWatch•Joseph Adinolfi
 Seguimientohace 21 h
First Half of September Trades Taken Results Day Trading
Pre FOMC tomorrow, these are my results so far 10 trades taken 6 wins 4 losses using 1.6 risk to reward (1.5 plus 0.1 for commissions) 125 tick stops 200 tick targets So far up 5.6R I am risking 3% risk per trade So far, I am ok with the results. Two losses were just random variance and didn't work out. Nothing to fret about that. The other two were just poor execution and being a dummy. One loss I entered in way too early before the pullback to the 20 and got tagged out. I reentered and tried it again. The other loss, I honestly don't know what I was thinking. I shorted right at the low of day and immediately got slapped. I occasionally have these dumb trades/squirrel brain moments. What I do is cut all losses at 125 ticks so if I am a moron, I am out fast. This is the one thing I do not mess around with. Get out and walk away. https://www.tradingview.com/x/AeRxKtR3/ https://www.tradingview.com/x/88yInlIa/ https://www.tradingview.com/x/zdEDqrD4/ With FOMC on Wednesday, I am taking the day off. I DO NOT touch FOMC Wednesday's. I have about 8 or 9 good trading days left in September. I might take 6-8 more trades depending on what presents and if my setups are there. My goal is to sustain the 60%-win rate I have and finish the month out with a 10R month.
TITradingView Ideas- TISeguimientohace 18 h
September 16th
Break structure to the upside (Long) Break structure to the downside (Short)?
TITradingView Ideas - Más recientehace 9 h
AAPL | September 16, 2026 | Trend Lines & Higher-Time-Frame Sign
Today's AAPL review focused on trend lines, higher time frames, and learning how to recognize signals before dropping down to the time frame where I actually execute my trades. I started by looking at the bigger structure and using trend lines to understand what price has been doing. From there, the focus was on reading the signals developing on the higher time frames and understanding why those signals can carry more weight in my overall analysis. In today's video, I covered: Using trend lines to better understand market structure Moving to higher time frames to get a clearer view of the bigger move Identifying signals developing on higher-time-frame charts Why a higher-time-frame signal can provide stronger context for my day trade Using the higher time frame to build the idea and the lower time frame to refine execution Waiting for price to confirm the higher-time-frame idea instead of assuming the signal has to work One thing I'm continuing to learn is that higher time frames aren't just about seeing more candles—they can change how I interpret what's happening on the lower time frames. If I see an important signal developing on a higher time frame, I want to carry that information with me when I move down to my execution chart. A move that might look random on a lower time frame can make a lot more sense when I understand the larger structure behind it. The goal isn't to let the higher time frame predict my trade. It's context. I can build the idea there, but I still want the lower time frame and price action to confirm whether that idea deserves a trade. Dad Stock Joke: I asked the higher time frame why it always seems to know more than the lower one. It said, “I've just been around longer.”
TITradingView Ideas