# GBPUSD Week W38-2026: Yield Pushes Toward 5% Yet Price Holds .
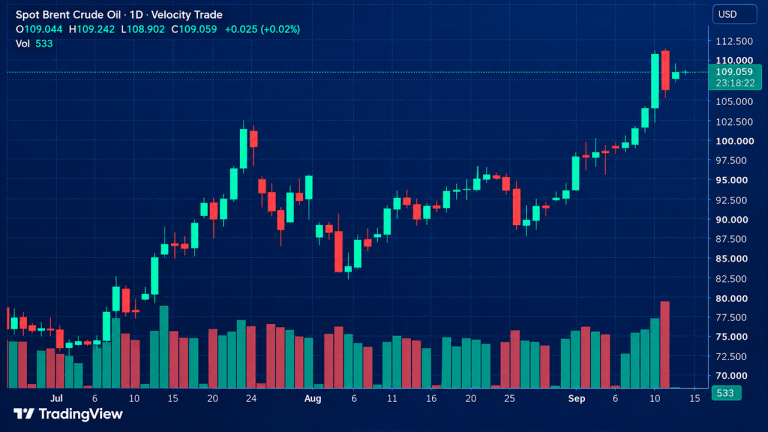
# GBPUSD Week W38-2026: Yield Pushes Toward 5% Yet Price Holds Above 1.34308, Bears Have the Story but Not the Setup | 15 September 2026 **Reference data** | week 2026-W38 - Symbol: GBPUSD - Week: 2026-W38 - Bias: bearish - Conviction: skip - Regime: ranging - FX implication: mean_revert - MTF alignment: bearish_mixed - VWAP weekly: 1.35016 - TrendSL weekly: 1.34308 - Thesis snapshot close: 1.34844 - Current market price: 1.34888 (as of 2026-09-15T05:55:00+00:00; source mt5:GBPUSD.sml:1m) - US 10Y yield: 4.96% - US 2Y yield: 4.63% - US 10Y real yield: 2.6% - DXY: bias=bearish, close_price=99.325 ## L0 - Regime Identification The immediate news backdrop heading into this week is striking in its contradiction. The US 10-year Treasury yield rose toward 5%, its highest level since 2007, which mechanically supports the dollar through the interest-rate channel -- higher yields attract foreign capital into US assets, lifting demand for USD. Simultaneously, GBPUSD fell to 1.3474, its lowest print since August 7, as Brent crude rose roughly 3% and safe-haven demand added a second tailwind to the dollar. On the UK side, July GDP printed at +0.4% month-on-month against a flat consensus, led by a matching 0.4% gain in services -- a genuine upside surprise that gives the Bank of England slightly more room to hold rates firm. Both the Federal Reserve decision and the Bank of England decision remained unknown at analysis time, meaning the central-bank story is incomplete. With all of that as backdrop, the regime reads as **ranging** (confidence 0.70). The FX implication of a ranging regime is mean reversion -- price tends to oscillate back toward equilibrium rather than trend cleanly in one direction. That framing matters because it immediately warns against treating the recent dip toward 1.3474 as the beginning of a sustained breakdown. ## L1 - Driver Stack The bearish case rests on a single macro pillar, with everything else either silent or mildly conflicting: -> ** Fed hawkishness / rising real yield (USD bullish):** The causal chain here is straightforward -- the Fed holds a restrictive stance, real yields rise (10Y real yield at 2.6%), which makes holding USD-denominated assets more attractive relative to alternatives, putting downward pressure on GBPUSD as the quote currency. A rising real yield (yield after stripping out inflation expectations) is the most durable form of USD support because it reflects genuine purchasing-power advantage, not just nominal rate noise. -> **BOE vs Fed rate differential as structural context:** The rate differential -- the gap between what each central bank pays -- currently favors the dollar. When that gap widens in USD's favor, carry trades (strategies where traders borrow in lower-yielding currencies to hold higher-yielding ones) structurally disadvantage GBP. However, the July GDP beat keeps BOE rate expectations alive, partially narrowing this differential on the margin. -> **TGA decline partially offsets USD bullish thesis:** The Treasury General Account fell 12.06% over four weeks to $843.7 billion (FRED, as of 2026-09-09). When the TGA drains, those funds flow back into the banking system, which historically eases USD funding conditions and can weigh on the dollar -- this partially conflicts with the hawkish USD thesis. It carries no calibrated directional score this week but cannot be ignored as a counterweight. -> **Price action, COT, and retail positioning: all silent this week.** Retail GBPUSD positioning sits at 54% long / 46% short (fxssi, 2026-09-15) -- close enough to balanced that no contrarian lean exists. When retail is this evenly split, the positioning data offers no additional directional edge. ## L2 - Macro Snapshot The 10Y yield at 4.96% sits just below the 5% threshold that historically triggers broader risk reassessment -- not because 5% is magical, but because it is a round number that concentrates options positioning and forces leveraged portfolios to revisit duration risk. The 2Y yield at 4.63% produces a 10Y-2Y spread of roughly 33 basis points positive, meaning the curve is no longer inverted in this segment -- a shift that has historically coincided with late-cycle USD strength rather than early-cycle weakness. The 10Y real yield at 2.6% is the figure that matters most for GBPUSD: at that level, the dollar offers a meaningful inflation-adjusted return, which sustains structural demand regardless of short-term risk-off fluctuations. The US liquidity proxy (Fed assets minus TGA minus overnight reverse repo) stood at $5,896.5 billion as of 2026-09-09, up $96.7 billion over four weeks. That net expansion in system liquidity is modest but not negligible -- it softens the tightening impulse from high yields. SOFR minus IORB at -3.0 basis points (FRED, 2026-09-11) indicates overnight funding is functioning normally, with no signs of stress that would force a disorderly dollar squeeze. VIX at 17.10 (yfinance, 2026-09-14) sits within the normal range for US equity volatility -- elevated enough to reflect uncertainty around the dual central bank decisions, but not at levels that historically trigger forced position liquidation. The CNN Fear and Greed index at 31/100 (2026-09-15) signals fear in US equities, which typically supports safe-haven dollar demand, though this is a US equity sentiment measure, not a direct FX positioning survey. DXY closed the thesis week at 99.325 with a bearish bias and a deliberate stand-aside conviction -- meaning even the dollar index itself lacks a clean directional signal this week, which matters because a genuinely strong USD impulse would normally show up in DXY first. ## L3 - Technical Structure As of Tuesday, 15 September 2026 at 05:55 UTC (source: mt5:GBPUSD.sml:1m, near-realtime), GBPUSD trades at **1.34888**. The thesis snapshot close used as the analytical anchor is 1.34844. Two precomputed structural facts define the current technical picture: First, price at 1.34888 is **below the weekly VWAP at 1.35016**, testing from underneath -- by a margin of roughly 13 pips. VWAP (Volume Weighted Average Price) over a weekly period acts as the fairness benchmark: dealers and institutions use it to assess whether their fills are above or below the week's average cost. Price testing from below the weekly VWAP means sellers currently have the structural advantage at this timeframe, but price has not reclaimed that level. Second, price at 1.34888 is **above the weekly TrendSL at 1.34308**, testing from above -- a gap of approximately 58 pips. The TrendSL (trend stop-loss level) is the threshold below which the medium-term trend structure would flip to confirmed bearish. The fact that price remains above it means the bearish directional label is **not yet confirmed by the technical structure**. This is an existing reality at the time of writing, not a hypothetical. The multi-timeframe alignment reads as bearish-mixed, which in practice means lower timeframes are leaning bearish but higher timeframes have not confirmed -- a setup where momentum traders and trend followers can find themselves on opposite sides of the same trade. ## L4 - Intermarket Cross-Check The DXY cross-reference is instructive. DXY carries a bearish bias with a stand-aside conviction at a close of 99.325 for the week. That combination -- bearish DXY but no actionable setup -- creates a direct tension with the GBPUSD bearish thesis. If the dollar index itself lacks enough confirmation to size a directional position, the case for aggressive GBPUSD shorts built primarily on USD strength becomes harder to defend. A weaker DXY, all else equal, would support GBPUSD rather than press it lower. The multi-timeframe alignment on GBPUSD reads bearish-mixed (mean_revert FX implication). In practical terms, bearish-mixed alignment means the trade idea and the timeframe structure are not in agreement across all horizons -- which historically raises the probability of whipsaws and false breaks. Traders who see the bearish narrative clearly and act on it in isolation, without waiting for timeframe convergence, are most exposed to that whipsaw risk. The mean-revert implication reinforces the ranging regime: any sharp move lower may attract buying interest before a sustained trend develops, and any sharp move higher may be sold back toward the weekly equilibrium. ## L5 - Event Risk This week carries two central bank decisions that will directly determine whether the rate differential story evolves or stalls. All dates below are sourced from ForexFactory calendar data (secondary source, not direct official issuer confirmation): -> UK Claimant Count Change: 15/09/2026 -> UK CPI y/y: 16/09/2026 -> Federal Funds Rate decision: 16/09/2026 -> FOMC Economic Projections: 16/09/2026 -> FOMC Statement: 16/09/2026 -> FOMC Press Conference: 16/09/2026 -> MPC Official Bank Rate Votes: 17/09/2026 -> Official Bank Rate (BOE): 17/09/2026 -> Monetary Policy Summary (BOE): 17/09/2026 | Scenario | Probability | |---|---| | Fed holds, signals fewer cuts in dot plot; BOE holds with hawkish language -- rate differential narrows, GBPUSD recovers toward VWAP | Plausible, consistent with ranging regime | | Fed holds, Powell signals prolonged restrictive stance; BOE cuts or signals cuts -- differential widens, bears get structural confirmation below 1.34308 | Bearish confirmation scenario | | Fed surprises with a cut or strong dovish pivot; BOE holds -- GBP outperforms sharply, bearish thesis collapses | Low probability but tail risk; both outcomes were unknown at analysis time | | Both central banks hold with neutral language -- no resolution, ranging continues, price oscillates between 1.34308 and 1.35016 | Consistent with current regime | Note that both outcomes remained unknown at analysis time. Any positioning taken before these decisions carries binary event risk -- the pair's next 150-200 pip move is effectively locked inside the Fed and BOE announcements on 16-17 September. ## L6 - Conviction Scorecard The overall bias is bearish, but the honest framing of this week's read is that the evidence is not yet convincing enough to size a directional position. The entire bearish case rests on the Fed hawkish / rising real yield signal. Price action contributes nothing confirming. COT data (institutional positioning, which is a lagged survey of futures participants -- note the brief does not specify the exact report week, net-position figure, or release date, so treat it as directional context only) is silent. The DXY itself carries a stand-aside read. Retail positioning is balanced. The technical structure has price above the level that would provide genuine bearish confirmation. That accumulation of non-confirmation is the story -- not a low score on a confidence scale, but a deliberate analytical choice to stand aside until one of the scenarios in L5 resolves. ## L7 - Time Horizon **Near-term (into 16-17 September):** Price at 1.34888 is sandwiched between the weekly TrendSL at 1.34308 below and the weekly VWAP at 1.35016 above, testing underneath the VWAP. Within this window, the Fed and BOE decisions dominate. Direction is essentially binary and event-driven. The mean-revert regime implies that sharp pre-event moves in either direction may partially reverse once the catalyst lands. **2-week horizon (the stated timeline):** If the Fed delivers a hawkish hold with a revised dot plot signaling fewer cuts, the rate differential widens and the bearish thesis gains its first technical confirmation if the weekly close drops below 1.34308. That would be the first moment the bearish label aligns with the price structure. Until then, the ranging regime contains the move. **Medium-term (beyond 2 weeks):** The July UK GDP beat at +0.4% month-on-month is a genuine fundamental counterweight. If the BOE uses it as justification to maintain or raise rates, the rate differential could begin compressing, which would shift the structural bias back toward GBPUSD stability or modest recovery. The medium-term picture depends heavily on whether the 10Y yield sustaining near 5% creates contagion effects (equity stress, credit spread widening) that paradoxically weaken the dollar through risk-off carry unwinds -- a carry unwind being the rapid unwinding of positions where traders borrowed in low-yielding currencies to hold USD assets, which sells USD in the process. ## L8 - Invalidation Conditions -> ** ** Price at 1.34888 is already above the weekly TrendSL at 1.34308. The technical structure contradicts the bearish bias from the outset. The bearish label reflects a macro-driven framework override, not a technically confirmed setup. Treat it accordingly. -> ** ** A weekly close below the TrendSL weekly at 1.34308 would provide the first genuine bearish structural confirmation -- aligning the technical picture with the directional label for the first time this cycle. Without that confirmation, the bearish thesis remains macro-only. -> ** ** Price sustained above the weekly VWAP at 1.35016 would represent short-term momentum moving against the thesis. Readers not currently positioned should wait to see how price resolves around the VWAP before assessing directional exposure. Readers already holding short exposure should reassess their own risk against the 1.34308 and 1.35016 levels as the two structural boundaries that define the current range. **The trader trap this week:** Reading the bearish narrative correctly -- rising yields, hawkish Fed, rate differential favoring USD -- and then entering short before either central bank decision, only to get caught in the BOE or FOMC reaction move that temporarily sends price back through the weekly VWAP at 1.35016. The direction may ultimately prove right over two weeks; the timing around back-to-back central bank events on 16-17 September is where correctly-biased traders historically absorb the most unnecessary drawdown. The ranging regime and mean-revert implication mean the pair can spike 80-100 pips in either direction on the headlines before resuming any underlying trend -- and that spike is where stops get taken before the move resumes. --- *This analysis is for informational and educational purposes only and does not constitute financial advice.* #GBPUSD #ForexTrading #FXAnalysis #CableForex #USDStrength #BankOfEngland #FederalReserve #FOMC #InterestRates #RealYield #ForexWeekly #MacroFX #CentralBanks #FXRegime #TradingView