Federal Reservepage 10

Organization · 2364 articles
Share

Coverage, page 10

page 10 of 119

USNAS100 | Bulls Target 29465 as Yields & Oil Retreat

USNAS100 is showing bullish momentum today, supported not only by the technical structure but also by an improvement in the short-term fundamental backdrop. Following yesterday’s Fed rate hike, Nasdaq futures are rebounding strongly as long-term Treasury yields ease and oil prices continue to retreat. Nasdaq 100 futures were up roughly 1% in early U.S. trading, outperforming the other major indices. Lower long-term yields are particularly supportive for technology and growth stocks because they reduce some of the valuation pressure created by higher borrowing costs. Technically The price is currently consolidating inside the 29280–29465 range, while momentum remains bullish as long as the market holds above the 29280 pivot. The first upside target remains 29465. A confirmed 1H candle close above 29465 would strengthen the bullish structure and support an extension toward 29680. On the downside, the bullish setup would begin to weaken if the market loses 29280. A confirmed 4H candle close below 29280 would shift momentum bearish and open the way toward 29040, followed by 28850 if selling pressure continues. Fundamental Structure The immediate environment is currently supportive for Nasdaq: oil is falling, the 10-year Treasury yield is easing, and technology shares are leading today’s recovery. However, the broader macro risk has not disappeared. The Fed raised rates by 25 bps yesterday to 3.75%–4.00%, and policymakers indicated that further tightening could be necessary. Markets are currently pricing roughly a 51% probability of another hike in October, up from around 44% before the decision. Pivot Line: 29280 Resistance: 29465 – 29680 Support: 29040 – 28850

TITradingView Ideas17 Sept

Mark the invalidation before you buy the pullback

The Fed raised rates a quarter point on Wednesday, to 3.75% to 4.00%, the first hike since July 2023. The dollar index went back through 100 on it. The part that matters for anyone buying pullbacks is the projections. In June the Fed's median had rates coming down to 3.6% by the end of 2027. In September it's 4.1% and staying there, with 16 of 18 officials pencilling in another hike this year. So every inflation and jobs release between now and the October meeting carries more weight than it did a month ago. That changes the order you should do things in. https://www.tradingview.com/x/YPAgEPAV/ Most people buy a pullback like this. Price comes back towards a moving average in a trend, it looks cheap, they get in, and then they go looking for somewhere to put the stop. Every pullback looks cheap while it's happening. You can't tell a pullback from the start of a reversal until price gets somewhere it shouldn't. So find that somewhere first. Pick the side off the trend. On the daily, if the 8 EMA is above the 21 you're only looking at buys. That's the whole first question and it takes two seconds. Mark the invalidation off the ATR. Take the weekly ATR, the distance the market normally travels in a week, and measure down from where you'd enter. That block is where the idea is wrong. If price gets in there the pullback has turned into something else. The stop goes there, and your size comes from the distance to it rather than from how much you like the chart. Check how much of the week is already spent. If the week has already travelled most of its ATR, there's less room left for a fresh target, and a good-looking entry with nowhere to go is still a poor trade. Then look at the target off the same ATR. Now the reward-to-risk is sitting on the chart before you've done anything. There's one more thing the ATR gives you if you draw the daily and the weekly sets together. You can split one entry into two pieces. One takes the nearer daily target. The other is held for the weekly level, and when the daily target pays, its stop goes to entry. If the week has already used up its normal range by then, that's a good sign the daily piece has had most of what the week was going to give. The first piece pays for the trade, and once it has, the second one is running for free. One honest thing about all of this. Buying a pullback in a trend isn't an edge on its own. Replay the simple version back through the daily bars on the pairs I've run it on, same stop, same target, and it comes out close to flat. What the order above does is make sure you know where you're wrong and whether the week's got room before you commit, which matters a lot more in a month where any single release could move a rate expectation. Where is the invalidation on the last pullback you bought, and did you mark it before or after you got in? Educational content. Not financial advice.

TITradingView Ideas17 Sept

Ethereum reclaims $2,431 as buyers absorb rate hike and regulatory setback

Key takeaways Ethereum gained 1.7% and reclaimed the important $2,431 level. US spot Ethereum ETFs lost $365.5 million across Tuesday and Wednesday. A break above $2,544 could target $2,626, while major support sits near $2,269–$2,282. Ethereum (ETH) gained 1.7% over 24 hours and reclaimed $2,431 despite the Federal Reserve’s first interest-rate increase in three years […]

CoinJournalCoinJournalHassan Maishera17 Sept

BITCOIN stable after the Fed Rate Hike. What's next?

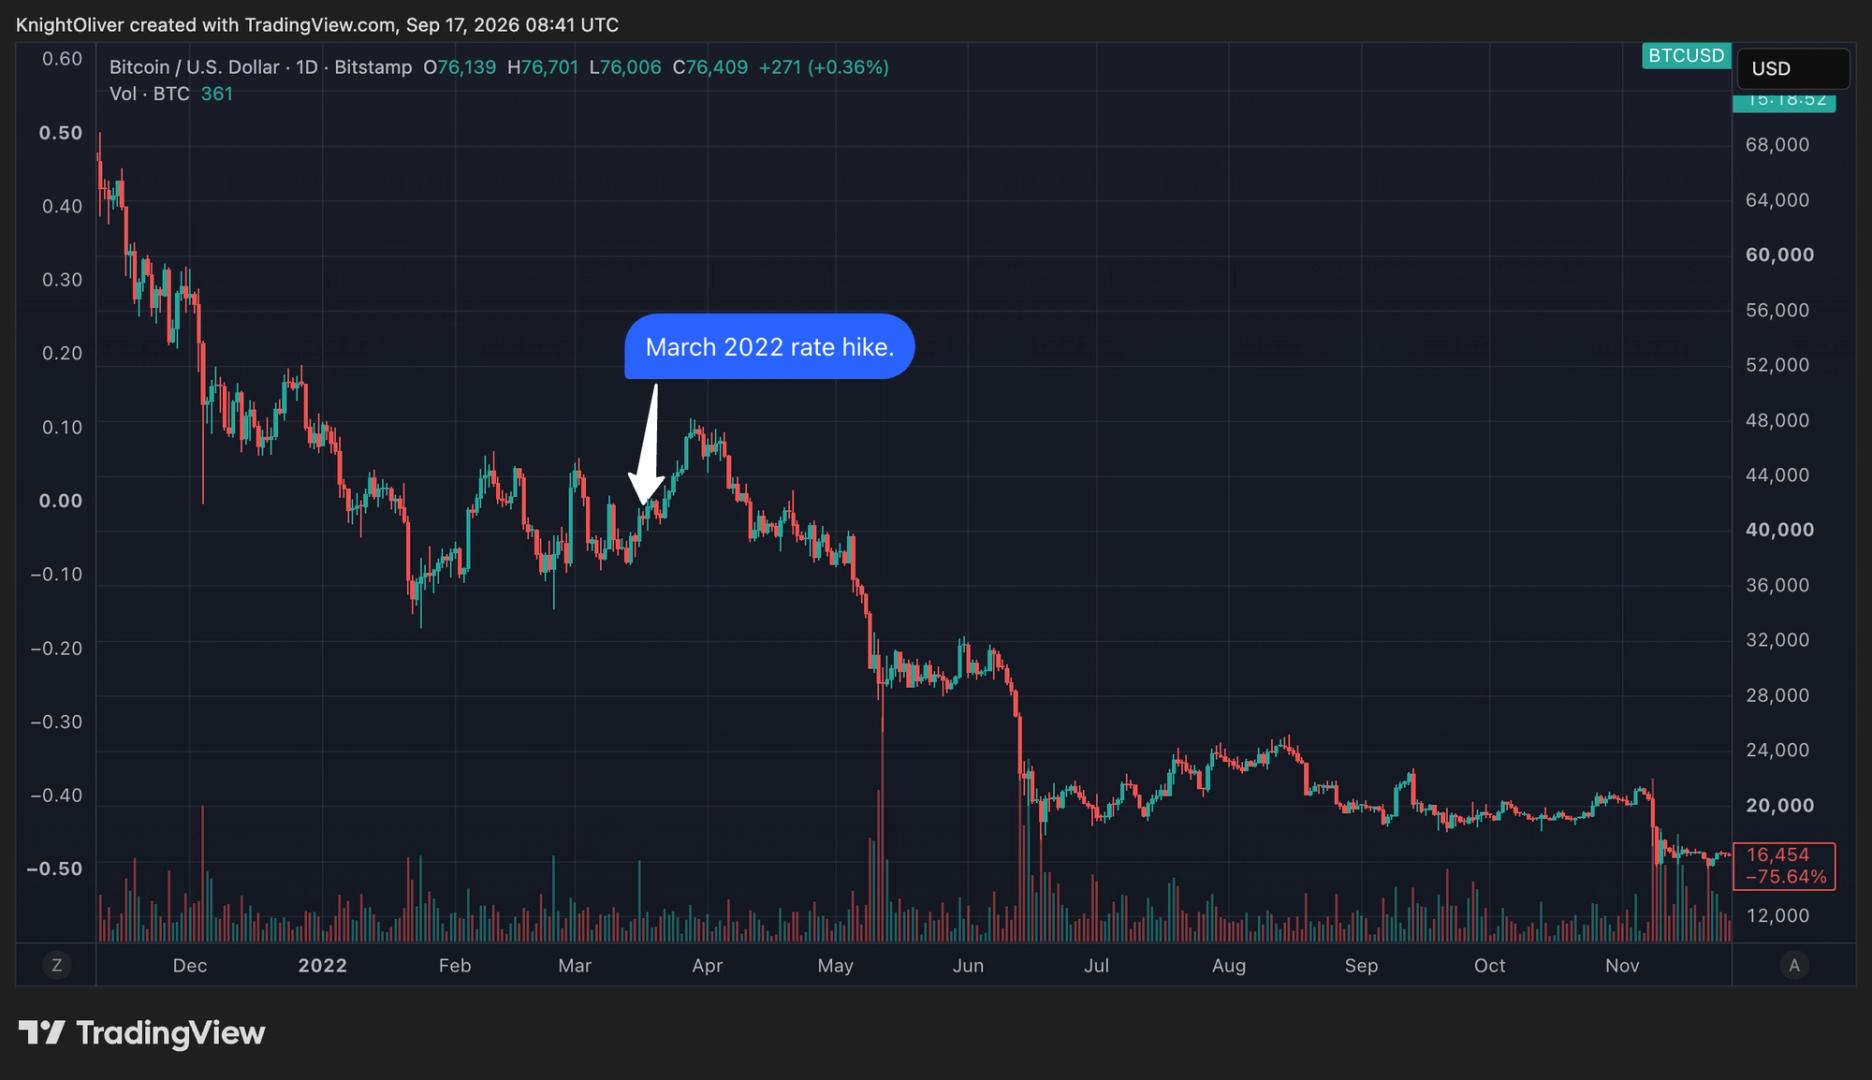
Bitcoin (BTCUSD) has remained mostly stable following the Fed's 0.25 bps rate hike yesterday, despite an initial sell-off on the stock markets. This shows incredible resilience and as we approach the designated end of the Bear Cycle (October 2026) based on the 4-year Cycle Model, the market has now sustained the pressure of two major economic events (counting also Tuesday's Clarity Act failure). So the picture becomes clearer. According to the past three Bear Cycles since 2014, BTC is on almost an identical 1W RSI pattern of Higher Lows. Only a touch on that trend-line can deliver a price near $60k again, similar to what happened in August 2015 or a 0.5 Fib pull-back as in March 2023. As mentioned numerous times, a weekly closing above the 1W MA50 (blue trend-line), confirms the new Bull Cycle immediately. The 1W MA200 (orange trend-line) is the technical market Support at the moment and any potential test is a buy opportunity. Especially as Bitcoin enters the 6 week period before the U.S. mid-term elections, which is expected to inflict strong volatility into the markets. Another striking similarity on this chart is that, after every bottom, the early stages of the Bull Cycles that followed have been inside a Channel Up. In 2020/21 and 2017, those led to parabolic rallies when they broke. In 2024/25 it was much calmer and controlled, almost an extension of the Channel Up itself. So use that to your advantage and once the 1W MA50 breaks, every minor correction towards it, would be a Bull Cycle buy opportunity. So is there enough time for one last pull-back or the 1W MA50 will break first? Feel free to let us know in the comments section below! --- ** Please LIKE 👍, FOLLOW ✅, SHARE 🙌 and COMMENT ✍ if you enjoy this idea! Also share your ideas and charts in the comments section below! This is best way to keep it relevant, support us, keep the content here free and allow the idea to reach as many people as possible. ** --- 💸💸💸💸💸💸 👇 👇 👇 👇 👇 👇

TITradingView Ideas17 Sept
  • neutral toward Federal Reserve · 98%

Gold H4: 4,250 Sweep or 4,100 Next?

FOMC is over. Now the real liquidity test begins. Gold remains trapped inside a broader H4 bearish structure after rejecting from the 4,680 area and continuing to print lower highs beneath the descending trendline. But after the post-FOMC volatility, price is now reacting directly above a major H4 demand zone. 📊 H4 Market Structure Current: 4,283.100 Trendline Resistance: 4,340–4,360 H4 Demand / SSL: 4,235–4,250 Lower H4 Demand: 4,095–4,120 The structure remains bearish below the descending trendline. But selling directly into 4,235–4,250 offers poor structural confirmation. 🔴 Bearish Scenario If H4 closes below 4,235–4,250 with displacement: 4,250 → 4,200 → 4,120–4,095 That would confirm continuation of the broader bearish structure. 🟢 Reversal Scenario If Gold sweeps 4,235–4,250 and quickly reclaims 4,300 with a lower-timeframe MSS: 4,250 → 4,300 → 4,340–4,360 A sustained H4 reclaim above the descending trendline would weaken the current bearish structure. 🌍 Post-FOMC Context The Fed raised rates by 25 bps to 3.75%–4.00%, while its projections kept further tightening risk on the table. Gold initially sold off toward the 4,240 area, then recovered as markets digested the decision and oil's rally lost momentum. The next move may depend less on the headline rate decision and more on which liquidity pool gets taken first. Does 4,250 become the post-FOMC floor — or the next breakdown trigger?

TITradingView Ideas17 Sept

XAU/USD: Defends the Floor, Buyers Reclaim 4,500

XAUUSD is reacting from the 4,250–4,310 buy zone, but price is still trapped below the long descending trendline and beneath the Ichimoku structure. This keeps the broader pressure bearish, while the current setup remains a conditional recovery trade. If buyers continue to defend the zone and Gold breaks and holds above the descending trendline, I’m watching: 🎯 Target: 4,500 Macro Market: The Fed has now raised rates and signaled that further tightening remains possible. The decision pushed the US Dollar and Treasury yields higher, creating a clear headwind for non-yielding Gold. This means any bullish recovery still needs strong technical confirmation rather than simply buying support. A sustained H2 move below 4,250 would weaken the recovery setup. AURICVERSE View: the buy zone is holding, but buyers still have one major job — break the descending trendline. If they do, 4,500 comes back into focus.

TITradingView Ideas17 Sept

FED raised rates, more dollar strenght possible

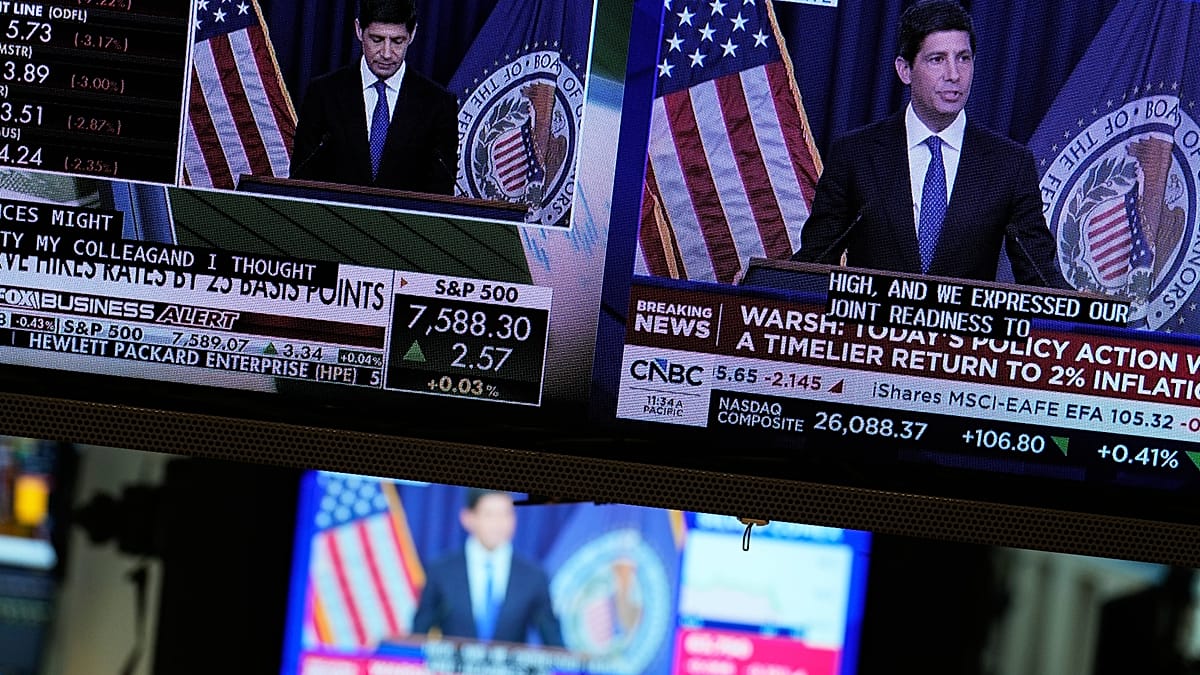
Yesterday, as you know, the Fed raised rates by 25 basis points as expected, but more importantly, Chair Warsh sounded very hawkish during the press conference. He said that inflation has been well above the 2% target for too long and that the Fed needs to bring it back towards that target. Some policymakers even voted for a 50-basis-point hike. So with the Fed delivering only 25 basis points this time, more hikes are still possible in the months ahead. That's why we saw such a strong move higher in US yields and the US dollar. Looking at US Treasuries, we are now seeing some stabilization after bonds and stocks recovered during the Asian session following Trump's comments that US interest rates should be lower. However, looking at the 10-year Treasury wave count, this still looks like only a wave four recovery, with important resistance around 106.57. So more weakness in bonds could follow, which would mean another move higher in yields and could keep the dollar supported. GH

TITradingView Ideas17 Sept

GOLD Consolidation recovery in Progress 4350 / 4380 on Focus

Gold is showing a strong rebound after the sharp sell-off, with price recovering from the 4,240 –4,260 liquidity/support area and moving back above 4,300. Tecnically latest upside reaction is partly connected to the market digesting the Fed's September rate decision. The Fed raised rates by 25 bps to 3.75%–4.00%, while the initial post-Fed selling pushed gold to a near six-week low. On September 17, gold rebounded more than 1% as investors reassessed the decision and the earlier oil rally lost momentum. At the same time, the USD remains firm and Treasury yields are elevated, which is limiting the upside and explains why gold is still reacting sharply around resistance. Geopolitical uncertainty is also contributing to two-way volatility. Key Levels to watch ; Support zone ; 4,300–$4,320 Resistance zone ; 4,350 / 4,380 Holding above 4300 keeps the bullish As long Price continues holding above 4,300 and confirms strength through the resistance zone, the next levels to watch are 4,350 / 4,380 for now, the chart remains a battle between bullish recovery and macro-driven selling pressure. Confirmation around the key levels will be important before assuming the next major direction. Hope you found this analysis helpful. 👍 Like, Comment & Follow for more updates.

TITradingView Ideas17 Sept

DeGRAM | NZDUSD remains under descending resistance

📊 Technical Analysis ● NZDUSD remains inside a clear descending structure, with the major resistance line continuing to cap recovery attempts. Price is also trading below the broken support line, which is now acting as additional resistance and keeps the broader 1H structure bearish. ● The current rebound could extend toward the 0.5752–0.5764 resistance zone. If sellers defend this area, another decline toward the 0.5690–0.5700 target zone becomes the main scenario. A sustained breakout above resistance would weaken the bearish setup. 💡 Fundamental Analysis ● The U.S. dollar remains supported after the Federal Reserve raised rates by 25 bp to 3.75%–4.00% and signaled that further tightening may be needed as inflation remains elevated. Strong August U.S. retail sales also reinforced the picture of a resilient U.S. economy, adding support to the dollar. ● New Zealand’s latest GDP data came in slightly stronger than expected, with the economy expanding 0.2% in Q2 and 2.6% year over year. That provides some support to the NZD, but the kiwi remains under pressure against the stronger U.S. dollar following the Fed’s hawkish rate move. ✨ Summary ● Bearish continuation remains the main scenario while NZDUSD stays below 0.5752–0.5764; target 0.5690–0.5700. A confirmed breakout above resistance would invalidate the immediate bearish setup. Share your opinion in the comments and support the idea with a like. Thanks for your support!

TITradingView Ideas17 Sept

XAUUSD — Post-Fed FVG Repricing Buy Setup

Gold is trading around $4,320 after a highly volatile post-FOMC session. The Fed raised rates by 25 bp to 3.75%–4.00% and signaled that additional tightening may still be needed, pushing the U.S. dollar to a seven-week high and lifting short-term Treasury yields. Despite that hawkish backdrop, Gold recovered more than 1% from the post-Fed low as traders reassessed positioning and oil prices eased from recent highs. Brent crude has also pulled back toward $104, reducing some of the immediate energy-driven inflation pressure, although broader Middle East risks remain elevated. SMC View H1 price remains inside the broader descending channel, so the higher-timeframe structure is not fully bullish yet. However, the latest move swept buy-side liquidity near $4,350–$4,360, delivered a strong bearish displacement, and then reacted sharply from the lower portion of the channel. The current rebound may represent bullish repricing after that liquidity event. The nearby FVG around $4,285–$4,305 is the key mitigation area to watch. A controlled pullback into this imbalance, followed by a bullish MSS or CHOCH, could confirm that buyers are rebuilding short-term order flow toward the upper liquidity zones. Main Trading Scenario Buy Priority: $4,285–$4,305 Condition: Wait for Gold to retrace into the FVG / discount area and form bullish rejection, followed by a lower-timeframe bullish MSS or CHOCH. Entry: $4,285–$4,305 after confirmation SL: Below $4,260 and the reaction low TP1: $4,345–$4,365 TP2: $4,390–$4,405 Key Zones to Watch $4,401.403 — Premium Bearish OB $4,345–$4,365 — Reclaimed buy-side liquidity / resistance $4,285–$4,305 — Main FVG buy zone $4,225–$4,245 — External SSL / Deep Discount Demand $4,260 — Immediate bullish invalidation area Descending channel resistance — Major structural barrier Prime Gold View The buy bias is focused on confirmed repricing from the FVG, not chasing the current recovery. If buyers defend $4,285–$4,305 and produce a clean bullish structure shift, Gold could rotate back toward $4,350–$4,365, with the $4,400 Premium Bearish OB becoming the larger upside objective. The broader channel remains bearish, so confirmation is essential before treating the recovery as sustainable. No confirmation, no trade.

TITradingView Ideas17 Sept