
MOEX to launch 5 crypto perpetual futures on Sept. 22
MOEX will launch perpetual futures tied to BTC, ETH, SOL, XRP and TRX indexes on Sept. 22 for qualified investors, settled in rubles.
MOEX will launch perpetual futures tied to BTC, ETH, SOL, XRP and TRX indexes on Sept. 22 for qualified investors, settled in rubles.

SOL's trading at 99.66 after a modest 1% bounce, but the STC picture is still firmly in the sellers' hands. Trend bias reads Downtrend, EMA55 sits overhead at 100.53, and just 9 bars ago price printed a bearish BoS through the 99.00 swing pivot. The bounce has only carried price into the upper half of the volatility band, with band upper at 102.03 acting as the next natural cap. Why it matters: on the 4H, that fresh bearish BoS is the dominant structural event, and the last swing high at 104.82 is still open and untested. Sellers defended EMA55 on the last leg down — until price reclaims that line on a closing basis, every push higher is a supply test, not a trend change. The compressed 1.75 ATR means moves are tight; the band edges frame the next reaction zones cleanly. Trigger to watch: a 4H close back above EMA55 at 100.53 with follow-through toward the band upper — that flips the near-term tone and puts the 104.82 swing high back in play. Failing that, a rejection in the 100.50-102.00 supply pocket keeps the bearish BoS alive and points price back toward the recent low. Invalidation: a clean 4H close above 104.82 takes the bearish structure off the table entirely. Targets: 96.77 — band lower and first magnet on a rejection. 95.82 — last swing low, the line that must hold. 102.03 — band upper on the reclaim scenario. Setup: Watching reaction at EMA55 (100.53) after the fresh bearish BoS through 99.00 — reclaim reopens 104.82, rejection points back to 95.82. Invalidation: A 4H close above the 104.82 swing high invalidates the bearish structure. Targets: 96.77 — band lower, first magnet on rejection · 95.82 — last swing low, structural line in the sand · 102.03 — band upper on an EMA55 reclaim

SOL's correction off the 110 high did more than pull back into support, it swept it. C dropped to 96, undercutting the A low at 97.38, then reclaimed back above the range within the same sequence. That's a rangebreaker CHoCH, and it printed with the larger trend, this whole ABC is corrective inside the bigger move up from the ~80 low in August, not a standalone bearish structure. Gate one, structure, still needs the descending trendline from the 110 high broken to fully confirm reversal, that line sits near 102 and hasn't been touched yet. But the character of the correction just shifted. A sweep below range lows followed by a reclaim is exhaustion behavior, not continuation behavior, sellers pushed through the obvious level and couldn't hold it. Gate two, the zone, is the reclaimed range itself, 96-98. This is now the level that needs to hold, not the level being tested for the first time. Gate three, the trigger, already printed on this timeframe, the reclaim above 97.38 after the C sweep is the CHoCH. But the entry isn't this candle. The way this pattern pays is on the retest, once the larger timeframe has shown the tell, weight goes on where a smaller timeframe comes back down to test the reclaimed range and holds it. That's the trade, not the reclaim itself. What makes the R:R on this kind of setup worth taking seriously is the stop sits tight against the range low that just got swept and reclaimed, while the room above runs back to the B high at 107 and the range top near 110. What invalidates it is a retest that fails, price closing back below 96, which would mean the sweep wasn't exhaustion, it was just the range breaking for real. The sweep already did the hard part of showing who was left to sell. The retest just confirms nobody meaningful was.

Solana, XRP, Bitcoin and Tron are facing key technical levels as short-term momentum weakens across the market.
 U.Today•Arman Shirinyan17 Sept
While the retail crowd thinks Solana's recent 2% recovery is the start of a massive breakout, the 4-hour chart is setting up a textbook short retest of its selling order block with an asymmetric 1:5 risk-to-reward ratio. 🚨 Current Structure: Price: $97.87 Reaction: Rebounded a minor +2.14% from its local low ($95.82) after a -10.75% dump from its local peak ($107.36). Pattern: Corrective Relief Rally inside a descending channel. Bias: Bearish below the $101.44 resistance zone. "The Level That Decides Everything": The $101.52 - $102.86 Selling Order Block. Bids are queued at the $101.44 entry price. If this supply zone rejects the relief rally, it clears the way for a deeper correction to take out local swing support. A daily close above $104.94 invalidates the setup. Targets: Target One at $94.69, Target Two at $83.93. The Move So Far: Dumped -10.75% from its $107.36 local high to its $95.82 low. On the macro scale, CRYPTOCAP:SOL is down 66.75% from its $294.33 All-Time High (Jan 2025) and up a massive +19,442.73% from its $0.5008 All-Time Low (May 2020). Fundraising Breakdown: Total Raised: $359.7 Million across 7 funding rounds. Key Rounds: Private seed sale raised $3.17 Million (price $0.04), Series A raised $20 Million, and the private sale in June 2021 raised $314.15 Million led by Andreessen Horowitz (a16z). ICO/IEO Entry Prices: Public ICO on Coinlist (March 2020) raised $1.76 Million at an entry price of $0.22. Early ICO participants are currently sitting on a massive ~445x return on investment. Unlock Pressure Ahead: Locked Supply: 0% locked. Solana is fully unlocked, meaning all legacy team, founder, and seed rounds are completely circulating. Supply Mechanics: Programmatic inflation is the sole driver of new supply. On August 28, 2026, the SGP-0002 "Double Disinflation" vote passed (67.001% approval), doubling annual disinflation from 15% to 30%, which massively accelerates its path to a 1.5% terminal floor. Key Levels: Resistance 1 / Resistance 2: $101.52 / $102.86 Entry: $101.44 (SHORT setup) Support (range): $94.69 - $83.93 Invalidation / Stop Loss: $104.94 Closing Thesis: Solana’s tokenomics are now fully unburdened by legacy VC unlock cliffs, and the network’s successful "Double Disinflation" vote significantly reduces future dilution. However, technicals rule the short-term. The 4-hour relief rally is running straight into an aggressive overhead selling block. Rejection at $101.44 sets up a perfect 1:5.00 short trade down to $83.93. Below it, the bearish thesis is locked in. 🎯 Bearish below $101.44. Above it, the story flips. Not Financial Advice. ALWAYS DYOR.

Sol reversal trade , I plant to take a long postion it is kind of risky but trading is all about taking risks anyways

Phoenix Trade's SOL collateral option enhances capital efficiency but introduces correlation risk, potentially amplifying market volatility impacts.
 CryptoBriefing•Editorial Team16 Sept
New developments extend BASIS across real-world asset and AI-native infrastructure while introducing automated reward restaking for BTC, ETH, SOL, and PAXG participants BASIS, the institutional-grade crypto yield and staking platform built on market-neutral execution infrastructure, is continuing to expand its institutional footprint with three new developments: an ecosystem partnership with XDC Network, a collaboration with
 BeInCrypto•Chainwire16 Sept
[PRESS RELEASE – London, United Kingdom, September 16th, 2026] New developments extend BASIS across real-world asset and AI-native infrastructure while introducing automated reward restaking for BTC, ETH, SOL, and PAXG participants BASIS, the institutional-grade crypto yield and staking platform built on market-neutral execution infrastructure, is continuing to expand its institutional footprint with three new developments: […]
Solana’s V1 upgrade expands transaction capacity 3.3x, giving its growing on-chain economy more room to scale.
 AMBCrypto•Ritika Gupta16 Sept
Solana : Triangle Breakdown—Is This Really a Bearish Reversal? SOL has broken below a visible triangle structure on the H4 chart. At first glance, this looks bearish. But when we zoom out and look at the higher-timeframe structure and the logarithmic chart, the picture becomes more complicated. The breakdown has happened, but several important support levels below price have not yet been decisively lost. That matters. A pattern can break while the larger market structure is still intact. So I don't consider this a high-conviction short setup yet. The Bigger Picture The recent move has been strong enough that the market may simply need to correct and rebalance before deciding on its next larger move. The H4 chart is therefore giving us a warning, not necessarily a complete reversal signal. For now, I would rather use the H4 structure to create a bearish bias and then move to the H1 timeframe to look for a cleaner short setup. That's a much better approach than selling directly into the H4 breakdown. The Important Scenario If SOL continues lower and the remaining support levels begin to break with acceptance, the bearish scenario becomes much stronger. But there is another possibility. If price returns higher and recovers a significant portion of today's decline, the breakdown could turn out to be a liquidity event rather than the beginning of a sustained downtrend. In that case, today's move may have done exactly what the market needed: remove liquidity → create fear → rebalance the market → prepare for the next move. This is why I don't want to make a strong conclusion from the triangle alone. Day Trading Plan For now, my focus is: H4: Directional context H1: Search for the short setup Lower timeframe: Entry confirmation If H1 gives us a clean bearish structure after a pullback, rejection or liquidity sweep, the short becomes much more interesting. If SOL instead reclaims the broken structure and recovers today's decline, I would step back and reassess the bearish thesis. Don't confuse a pattern break with a confirmed trend reversal. That's one of the most important lessons on this chart. Final View I would describe the current setup as: Bearish — but not yet high conviction. The triangle has broken, but the market still has important support underneath. The logarithmic view also reminds us that after a strong directional move, correction is normal. So rather than predicting that SOL must continue falling, I'm watching the H1 structure for confirmation. If sellers prove themselves, we trade the short. If the market reclaims the breakdown, we don't force the idea. The chart doesn't owe us the direction we expect. Our job is to react when the structure confirms it. Fundamentally, Solana continues to have a large and active ecosystem across DeFi, payments, consumer applications and other on-chain activity. Recent network developments include the activation of Transaction V1, which increases the maximum transaction size from 1,232 to 4,096 bytes, expanding what can be executed in a single transaction. At the same time, SOL remains highly sensitive to broader crypto liquidity and market risk. Recent market coverage has highlighted the importance of the roughly 100 Dollar area and the 103–106 Dollar resistance region, showing that price remains in a technically important area rather than a clean one-directional trend. Risk Warning: This analysis is for educational purposes only and is not financial advice. Crypto assets are highly volatile. Wait for confirmation, define your invalidation and never risk more than you can afford to lose.
SOL sits at $100. Claude AI predicts three 2026 scenarios, hinging on $118.60 resistance and $96.24 support.
 Coinspeaker•Daniel Francis15 Sept
SOL is showing strong bearish momentum after breaking below the **102.00 support/BOS area**. Price has rejected higher levels and is now trading around **97.93**, confirming downside pressure. **🎯 Target:** 95.71 **📉 Bias:** Bearish / Sell **⏱️ Timeframe:** 1H **⚠️ Key Resistance:** 102.00–105.00 A sustained move below the recent lows could open the way toward the **95.71 target**. Trade with proper risk management and wait for confirmation before entry.

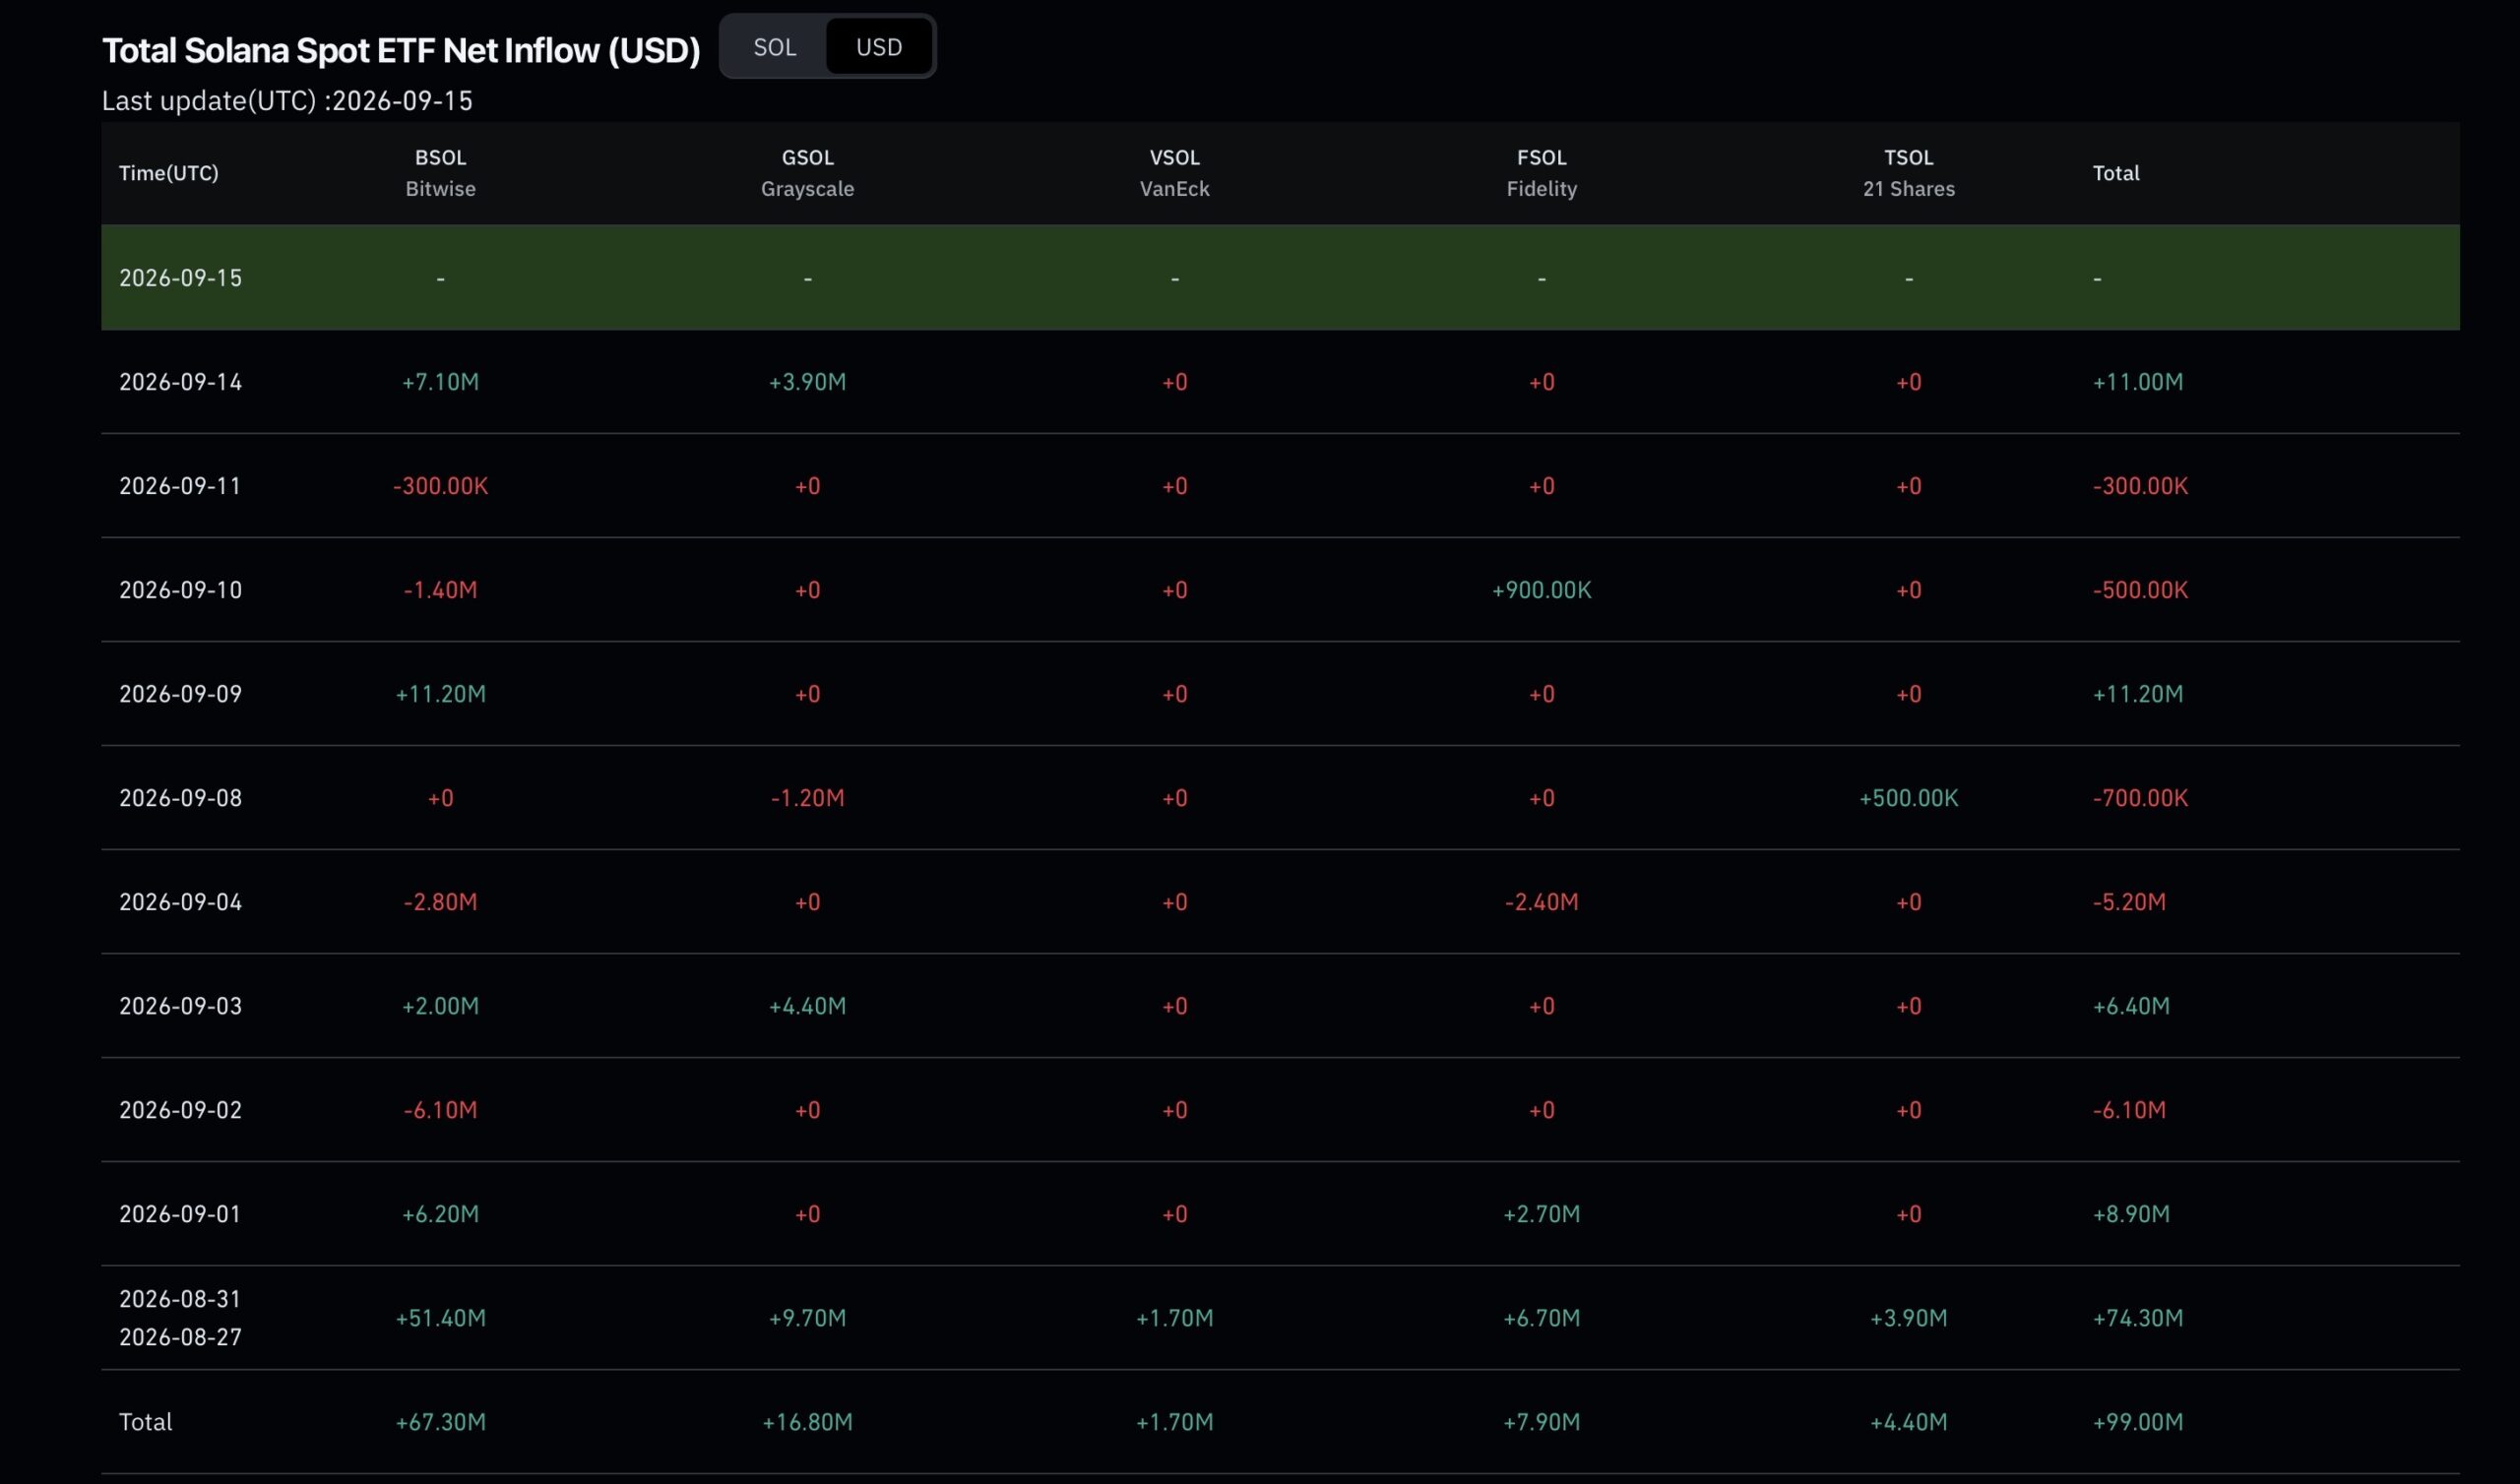
Stablecoin growth stayed below 6% while ETH and SOL gained more than 32%, leaving the inflow picture unresolved.
 CryptoSlate•Liam 'Akiba' Wright15 Sept
DeFi Development Corp added another 55,491 SOL and opened a CHAD at-the-market program for its preferred stock, extending a fast-moving three-week run of capital markets activity.
SOL's trading at 101.16 with the STC trend bias flipped to Downtrend on the 4H. Price is stuck in the lower half of the volatility band (upper 103.88, lower 99.09), pinned just under EMA21 at 101.48 and EMA55 at 101.72 — the trend backbone is now acting as a lid rather than support. The last bullish BoS at 105.91 is 53 bars stale, and the more recent structure that matters is the swing high at 105.80 (still open, 22 bars back) sitting above, with the swing low at 98.00 still open below. Why it matters: the failure to reclaim EMA55 after a 1.3% down day, combined with band positioning in the lower half, tells you sellers are defending the mean. Until price closes back above 101.72 with an ATR-buffered break, the path of least resistance is a retest of the 98.00 shelf. That's the line drawn on your chart — a clean loss opens the door toward the window low territory. The setup activates on a rejection wick into the 101.70-102.00 EMA cluster followed by a 4H close back under EMA21. Invalidation is a 4H close above 103.88 (the upper band and clean trend reclaim) — above that, the downtrend read is done. First target 99.09 (lower band edge), second 98.00 (swing low that's still open), stretch 96.40 (roughly one ATR beyond the swing). Setup: Rejection into the 101.70-102.00 EMA cluster followed by a 4H close back under EMA21 triggers the continuation lower. Invalidation: 4H close above 103.88 (upper band) invalidates the downtrend read. Targets: 99.09 — lower band edge, first reaction zone · 98.00 — open swing low, the key structural test · 96.40 — roughly one ATR beyond the swing, stretch objective

SOL is still moving below a clear descending trendline, and that trendline has already rejected price several times. The structure is now getting tighter near the lower part of the channel, so the next reaction is important. I’m watching for a clean bullish break rather than chasing inside the trendline. For the bullish move to become valid, I want to see a strong bullish 4H candle break and close above the descending trendline, backed by clear volume expansion. RSI is currently around the neutral area, so I’d like to see RSI turn higher and move above its MA as momentum shifts to buyers. A successful retest and hold above the broken trendline would add stronger confirmation. If SOL gets rejected again, the bullish idea is delayed and another move toward support remains possible.

SOLUSDT is trading around 102.1 USDT after facing rejection once again at the resistance trendline extending from the 107 level. The price has yet to break the sequence of lower highs, indicating that sellers remain in control of the upside. The 103.5–104.5 zone currently serves as a critical resistance area. If SOL attempts a rebound but fails at this level—subsequently losing the EMA34–EMA89 cluster around 101.7–102.0—I lean towards a scenario where the price drops to 100 USDT and extends toward the primary target near 99.0 USDT. Macro factors today also support a corrective scenario. Brent crude is rising back toward 107 USD/barrel and the 10-year Treasury yield has touched 5%, while the market prices in a roughly 90% probability of a 25bp Fed rate hike this week. This remains a challenging environment for risk-on assets and high-beta altcoins like SOL. The bearish outlook would weaken if SOL clearly breaks out above the trendline and firmly holds levels above 104.5–105.0.

Solana’s tokenized-stock market is gaining traction as SOL faces a key breakout test.
AMBCrypto•Muriuki Lazaro14 Sept
The Elon Musk-backed Grok AI predicts that by January 1, 2027, Solana (SOL) could trade around $350–$450, with a target range of $380–$420, assuming a full-blown crypto bull market returns by late 2026. As of September 13, 2026, SOL trades just above $100, significantly below its January 2025 all-time high of around $295–$296. This outlook […]
Coinspeaker•Daniel Francis13 Sept